Occupancy is one of the most consequential numbers in contact center operations, yet it is frequently misread. Managers who push occupancy too high burn out their teams. Managers who misunderstand what it measures confuse it with utilization and draw the wrong conclusions from their reporting. Getting occupancy right — understanding what it tells you, what it does not, and how it connects to staffing models — is foundational to running a sustainable contact center.
Agent occupancy is the percentage of logged-in, available time that agents spend actively handling contacts — including talk time, hold time, and after-call work (ACW) — as opposed to being idle and waiting for the next contact to arrive. An agent with 80% occupancy spent 80% of their available time in active handling and 20% idle between contacts. Occupancy does not include time spent in breaks, training, meetings, or other scheduled non-available states; those activities are captured by adherence and shrinkage metrics.
The idle time in occupancy is not wasted time. It is the buffer that allows agents to finish one contact cleanly before the next arrives, to stay mentally composed under sustained volume, and to give the operation room to absorb unexpected spikes. Eliminating that buffer entirely is how contact centers end up with queues that can never recover from a Monday morning surge.
The occupancy formula
The calculation is straightforward:
Occupancy % = (Total Handle Time ÷ Total Time Available) × 100
Where the components are defined as:
- Total Handle Time = talk time + hold time + ACW time, summed across all contacts handled in the measurement period
- Total Time Available = all time the agent was logged in and available to receive contacts, including idle time between calls
As an example: an agent works a four-hour available block and handles contacts with a combined talk time of 90 minutes, hold time of 15 minutes, and ACW of 15 minutes. Total handle time is 120 minutes. Total time available is 240 minutes. Occupancy = (120 ÷ 240) × 100 = 50%.
It is important to be precise about what "Total Time Available" includes. It covers the full period the agent is in an available or ready state — including the idle intervals between calls. It does not include scheduled breaks, lunch, training sessions, team meetings, or any other non-phone activity. Those non-available states are tracked separately through schedule adherence reporting and shrinkage calculations. Mixing them into the occupancy denominator produces a number that is neither occupancy nor utilization and is not useful for staffing decisions.
Occupancy vs utilization
Occupancy and utilization are frequently used interchangeably in contact center discussions. They measure different things.
Occupancy is a narrow measure: how much of an agent's available (ready-to-handle-contacts) time is spent actually handling contacts. It excludes all scheduled non-available activities.
Utilization is broader: how much of the agent's total paid shift time is spent on any productive activity, including training, meetings, coaching sessions, and other off-phone work. An agent on a full eight-hour shift who spends two hours in training and six hours available (with an occupancy of 80% during those six hours) has a utilization well above 80% when training is counted as productive time.
The distinction matters for different decisions. Occupancy drives staffing model inputs — it reflects the demand-driven workload on agents who are available to handle contacts. Utilization drives labor cost analysis — it tells you how much of the compensation you are paying is going toward productive activity of any kind. Using occupancy data when you need utilization data, or vice versa, leads to staffing decisions and cost calculations that do not match reality.
What occupancy levels mean in practice
Occupancy exists on a spectrum. The right level depends on your operation's service level targets, channel mix, contact complexity, and tolerance for queue build-up during peaks. The following ranges describe what each zone typically looks like operationally:
| Occupancy range | Operational characteristics |
|---|---|
| Below 75% | Agents have significant idle time between contacts. Cost-inefficient — you are paying for availability that is not being used — but the operation has an excellent buffer to absorb volume spikes without queue build-up. Typical in low-volume, high-complexity environments where agent readiness matters more than utilization. |
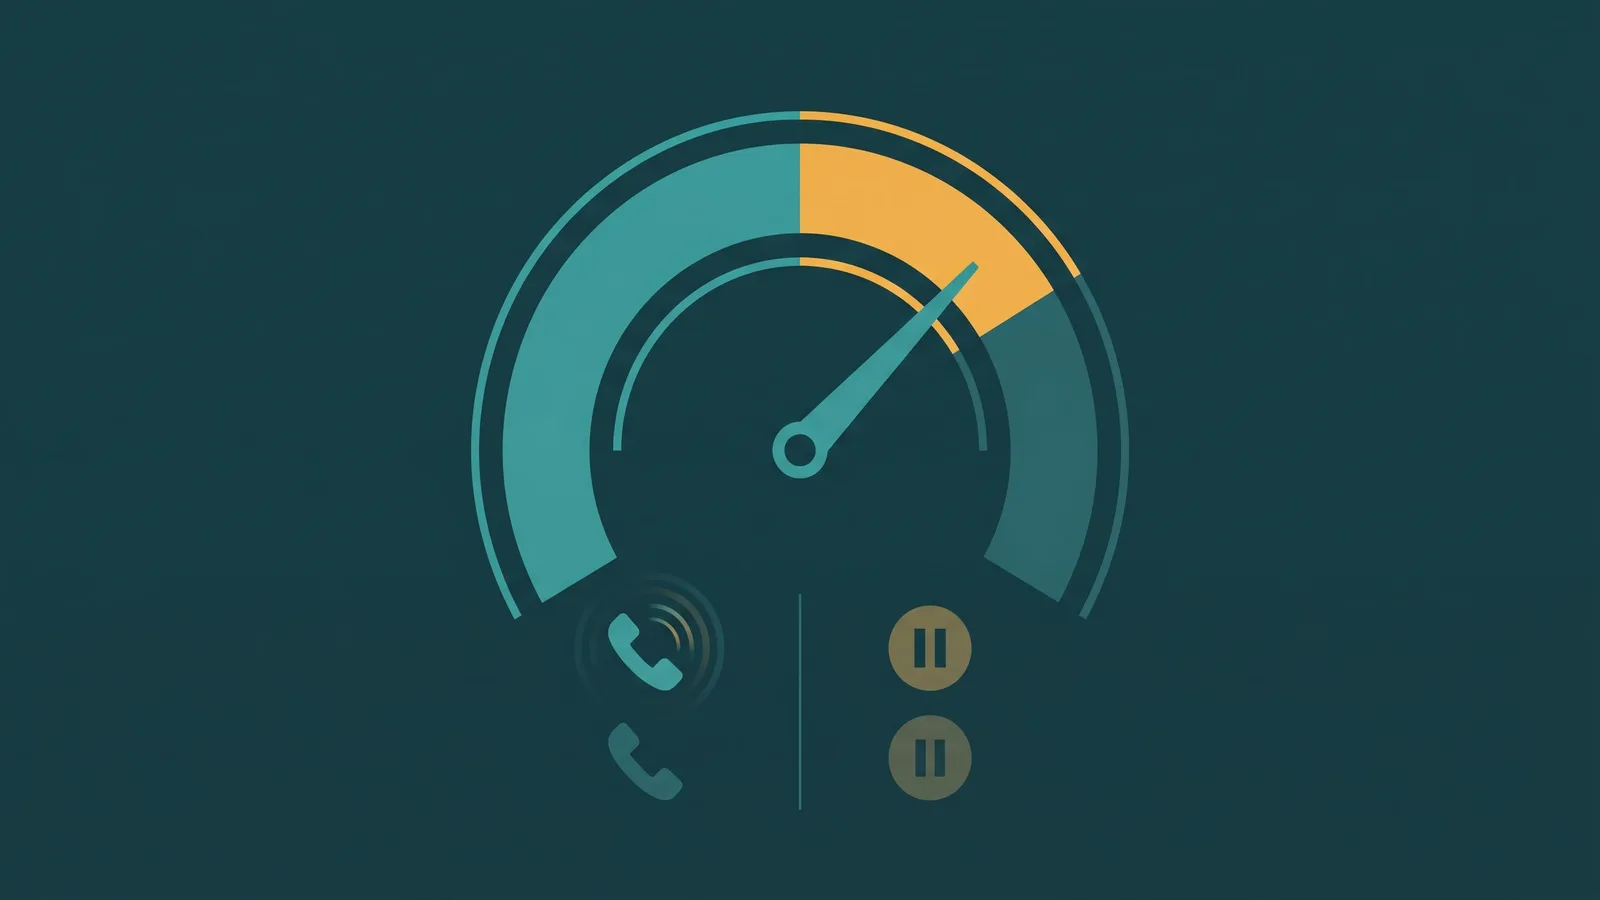
| 75–85% | Generally considered the target range for most call center environments. Agents handle a steady, sustainable flow of contacts with meaningful recovery time between calls. Service level is reasonably resilient against moderate volume variation. This is the band most workforce planning models aim to produce. |
| 85–90% | Agents are busy for most of their available time. Service level starts to become sensitive to volume spikes — a 10–15% surge in arrivals can quickly build a visible queue. Sustainable for short intervals but not as a steady-state operating condition across entire shifts. |
| Above 90% | Very little idle buffer remains. Any volume spike immediately begins building a queue that the available agents cannot absorb. Agent fatigue increases measurably. Not sustainable as a steady-state condition — teams running at 90%+ consistently experience accelerating burnout, rising attrition, and eventually degraded service quality. |
These ranges are not universal absolutes. A technical support queue handling 45-minute calls has a very different occupancy profile than a high-volume sales queue handling 3-minute calls. The principle — that high occupancy reduces buffer and increases fragility — holds across environments even when the right target number varies.
The Erlang C connection
Understanding why occupancy behaves the way it does requires understanding how it emerges from staffing models. In Erlang C — the formula used to calculate how many agents are needed to meet a service level target — occupancy is a direct mathematical output, not a choice.
The core relationship is:
Occupancy = Traffic Intensity (Erlangs) ÷ Number of Agents
Traffic intensity in Erlangs is calculated as contact arrival rate multiplied by average handle time. If your center receives 120 contacts per hour with an average handle time of 4 minutes (0.067 hours), traffic intensity is 8 Erlangs. With 10 agents, occupancy is 80%. With 9 agents, occupancy rises to 89%. With 8 agents, it reaches 100% — the system is unstable and the queue will grow indefinitely.
This means you cannot independently set occupancy. Occupancy is determined by the ratio of traffic load to agent count. The only lever you have to lower occupancy is to add agents (or reduce handle time). This is why occupancy and service level are inversely correlated: to improve service level, you need more agents; more agents lower occupancy. You cannot simultaneously run very high occupancy and excellent service level without one of two things happening — handle time collapses (meaning agents are rushing contacts, which damages quality), or agents absorb the gap through fatigue and burnout.
In Erlang C, as occupancy approaches 100%, the predicted queue grows toward infinity. This is the mathematical explanation for why contact centers running at 95% occupancy feel permanently behind: the model predicts they will never fully clear the queue.
Why chasing high occupancy is counterproductive
The instinct to push occupancy high is understandable — idle agent time looks like wasted cost on a labor efficiency report. But sustained high occupancy reliably produces outcomes that cost more than the labor savings it appears to generate.
At occupancy levels above 90% sustained across a shift, agents experience cognitive fatigue that accumulates faster than it can be recovered between calls. The short idle intervals that remain are not enough for mental reset between back-to-back complex contacts. The downstream effects are measurable:
- Higher error rates: Fatigued agents make more mistakes in documentation, process adherence, and problem resolution — increasing repeat contacts and rework.
- Lower CSAT: Agents without recovery time between calls carry frustration from difficult contacts into the next interaction. Customer experience scores reflect this.
- Higher attrition: Contact center attrition already runs high relative to most industries. Chronically high occupancy accelerates it further. Replacing an experienced agent — accounting for recruiting, onboarding, training, and the ramp period to full productivity — is expensive. The cost typically exceeds months of the labor "savings" that high occupancy was supposed to produce.
- Service level collapse: A team operating at 93% occupancy has almost no resilience. A single agent absence, a brief volume spike, or a run of longer-than-expected calls pushes the interval to 100%+ occupancy and builds a queue that takes the rest of the shift to recover, if it recovers at all.
Short-interval peaks where occupancy momentarily hits 100% are normal and unavoidable in any queue system. What is not sustainable is treating 90%+ as a target rather than as a warning signal that staffing needs to be reviewed.
How to use occupancy in workforce planning
Occupancy is a planning input, not just a scorecard metric. When you review occupancy reports by interval, they reveal the structure of your staffing problem in ways that daily or shift-level summaries hide.
Identifying over- and under-staffed intervals: Occupancy by 15- or 30-minute interval across a week will show you exactly where you are chronically understaffed (consistently high occupancy) and where you are overstaffed (consistently low occupancy). These are the intervals where your schedule needs adjustment, not the aggregate numbers.
Justifying headcount additions: When occupancy in a specific interval or queue is consistently above 85–88%, that is a data-grounded argument for additional agents. It translates directly into Erlang C: show the traffic load, show the current agent count, show the resulting occupancy, and show what adding one or two agents would do to the occupancy and the service level prediction.
Setting SLA-based staffing targets: In your Erlang model, you can work backward from a service level target (for example, 80% of calls answered within 20 seconds) to the agent count required, and read off the resulting occupancy. That occupancy becomes your operating target for that queue and interval profile. If your actual occupancy is consistently above that target, you are understaffed. Consistently below it, you may be overstaffed or experiencing lower-than-forecast volume.
Monitoring the effect of handle time changes: Because occupancy is directly driven by traffic intensity (volume multiplied by handle time), any initiative that reduces average handle time — ACW automation, better knowledge tools, improved scripts — will lower occupancy at the same agent count. Tracking occupancy before and after such initiatives shows the real staffing impact of operational improvements, which can be used to redeploy or reduce headcount deliberately rather than through attrition.
For a fuller treatment of how forecasting and Erlang staffing calculations work end to end, see Call Center Forecasting and Scheduling. For occupancy in the context of the broader set of metrics that define contact center performance, see Call Center Metrics and KPIs.
Frequently asked questions
Use our free Occupancy Rate Calculator to see your current occupancy, idle cost, and optimal agent count — no email required.
Occupancy is one metric in a broader set of interdependent measures. For the full picture of how contact center performance is tracked and interpreted, see Call Center Metrics and KPIs Explained. For how occupancy fits into the workforce management cycle of forecasting, scheduling, and intraday adjustment, see Call Center Workforce Management and the EaseDial WFM feature. And for the staffing calculations that produce occupancy as an output, see Call Center Forecasting and Scheduling.