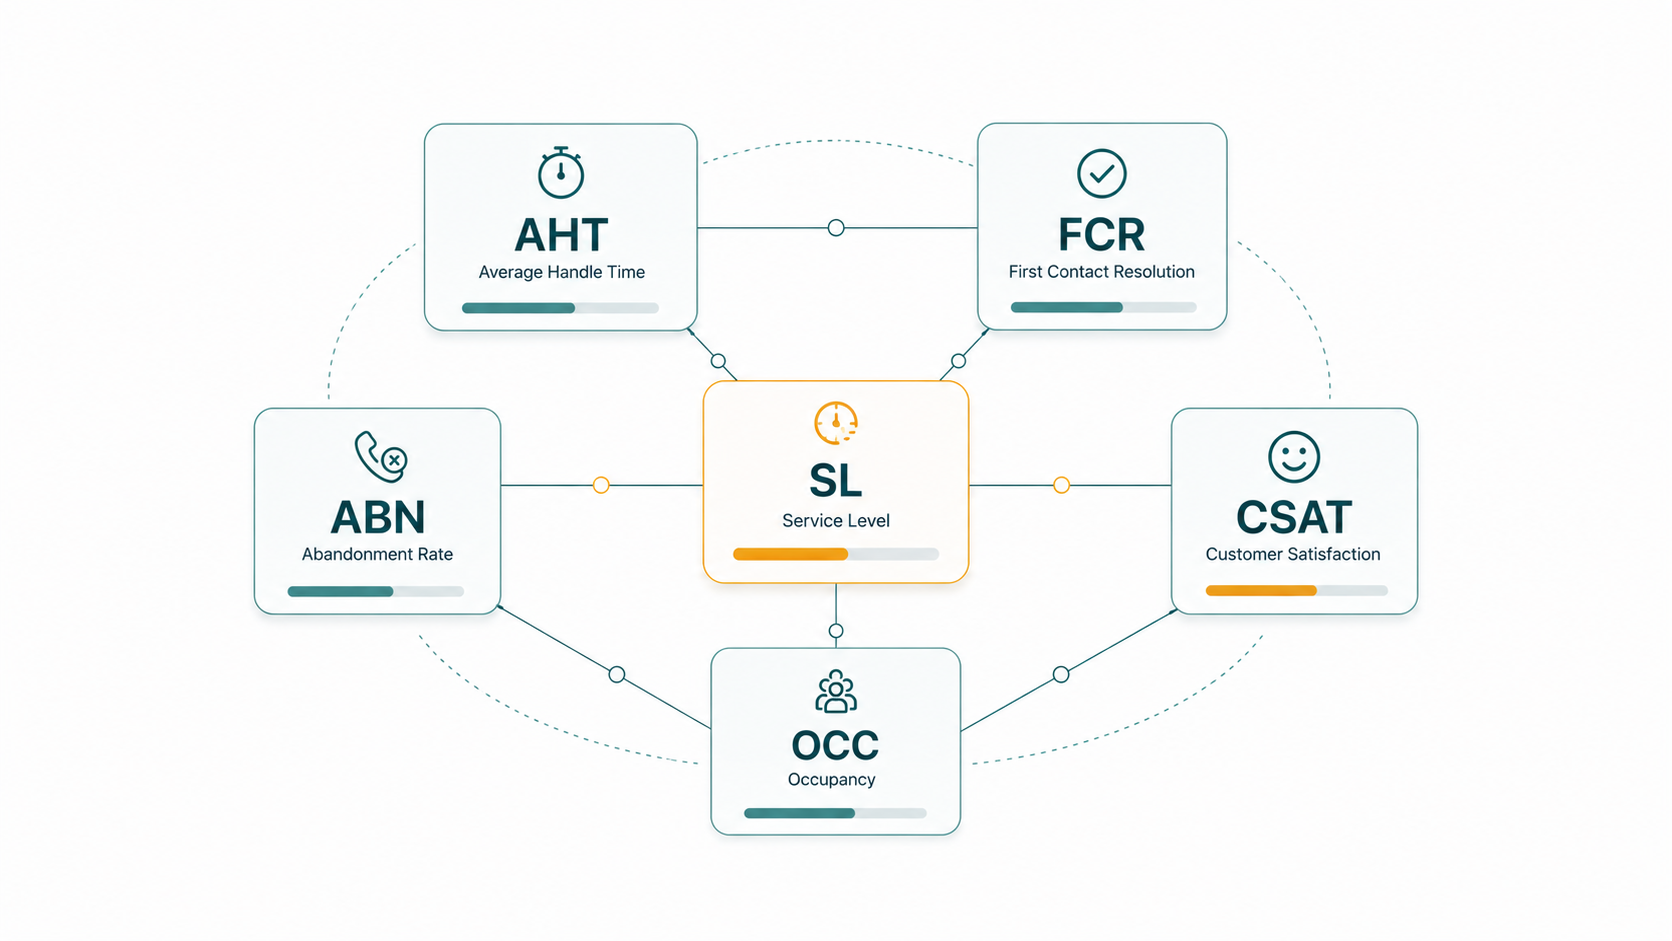
Call center metrics and KPIs are the quantitative measures used to evaluate contact center performance across efficiency, service quality, customer experience, and staffing. This guide covers how each core metric is defined, how it is calculated, what it indicates, and — critically — how it can be misread. For analytics platforms and reporting strategy, see Contact Center Analytics.
Metrics are only useful when you understand what they actually measure and what they do not. Every metric in this guide has a formula, a useful signal, and a limitation. Knowing all three is what separates teams that improve from teams that generate numbers and wonder why performance does not change.
One principle applies across every metric here: benchmarks are contextual. A figure that is acceptable in one environment may be a serious problem in another. Wherever possible, compare your metrics to your own historical performance and to industry data that uses the same measurement definitions — not to generic thresholds that appear in presentations without context.
Contact volume
Definition: Total contacts received in a defined period. Includes all inbound contacts across all channels: phone calls, chats, emails, callbacks.
What it indicates: The baseline demand your operation must handle. Volume is the denominator behind almost every other operational metric and the primary input to workforce planning and forecasting. Volume trends — growing, declining, or shifting between channels — indicate changes in customer behavior, product issues, or marketing effects.
Interpretation: Volume alone tells you nothing about whether your operation is handling it well. It must be paired with staffing data, service level, and quality metrics to produce insight. Sharp volume spikes are usually signals of a product issue, a billing event, or a campaign driving unexpected demand — worth investigating qualitatively alongside the number.
Service level
Definition: The percentage of inbound contacts answered within a defined time threshold.
Formula: Service Level % = (Contacts answered within threshold ÷ Total contacts offered) × 100
Format: Always expressed as two numbers — a percentage and a time. "80% answered within 20 seconds" is a service level target. "80%" alone is not — it is meaningless without the time component.
What it indicates: How quickly callers are reaching agents. Service level is primarily a staffing adequacy metric: consistently missing your target usually indicates understaffing, poor schedule adherence, or volume exceeding the forecast — not typically individual agent performance problems.
Interpretation caution: The 80/20 format is widely referenced in the industry, but it is not a universal standard. Organizations set their own targets based on their customer expectations, competitive position, and cost constraints. A healthcare crisis line and an outbound sales queue have very different appropriate service level targets. Do not import a benchmark from a different context.
Abandonment rate
Definition: The percentage of inbound callers who disconnect before reaching an agent.
Formula: Abandonment Rate % = (Abandoned calls ÷ Total inbound calls) × 100
What it indicates: Customer patience with wait times. High abandonment is a strong signal of service level problems — callers who have been waiting too long and given up. Abandonment rate is inversely correlated with service level: when you answer calls faster, fewer callers abandon.
Interpretation caution: Many organizations exclude very short abandons — contacts that disconnect very quickly after entering the queue — from the abandonment rate calculation. These are typically misdials or callers who immediately realized they had called the wrong number. The threshold for "short abandon" is a reporting convention that varies by organization and platform. Whether your calculation includes or excludes short abandons significantly affects the resulting percentage, and you must apply the same definition consistently to make trend comparisons valid. Always document which contacts are excluded from the denominator and why.
To calculate abandonment rate from your own queue data — with an optional short-abandon exclusion — use the free Call Abandonment Rate Calculator. Enter your offered and abandoned call counts and see the formula substituted with your numbers.
Average Handle Time (AHT)
Definition: The average total time an agent spends on a contact from answer to completed after-call work.
Formula: AHT = Average Talk Time + Average Hold Time + Average After-Call Work (ACW)
What it indicates: How long individual contacts take to process. AHT is a key input to staffing calculations — longer handle times mean each agent handles fewer contacts per hour, which increases the agents required to meet service level targets.
Interpretation caution: Lower AHT is not automatically better. An agent with a very low AHT might be cutting calls short, transferring unnecessarily, or resolving contacts superficially rather than completely. High AHT is not automatically worse — a complex technical support call that takes 18 minutes to fully resolve may be preferable to a 4-minute call that sends the same customer back a week later. AHT should always be interpreted alongside First Call Resolution. AHT is not just talk time — omitting hold time or ACW from the calculation understates the true handle time and produces misleading comparisons.
Average Speed of Answer (ASA)
Definition: The average time callers spend waiting in queue before reaching an agent.
Formula: ASA = Total queue wait time ÷ Number of calls answered
What it indicates: A summary measure of how long callers wait. ASA is related to service level but measures it differently — as an average across all calls rather than as the percentage meeting a threshold.
Interpretation caution: ASA is an average and is therefore dragged upward by a small number of very long waits. An ASA of 45 seconds might reflect a scenario where most callers wait 10–15 seconds and a handful wait several minutes — or it might reflect a more uniform wait pattern. Service level (the percentage answered within a threshold) better describes what a typical caller experiences. Additionally, the treatment of abandoned calls in the ASA denominator matters: if abandoned calls are excluded, ASA will look better than if they are included, because it only counts calls that eventually connected. Be explicit about which convention your reporting uses.
First Call Resolution (FCR)
Definition: The percentage of contacts resolved on the first interaction, without the customer needing to call back about the same issue.
Formula: FCR % = (Contacts resolved on first contact ÷ Total contacts) × 100
What it indicates: Resolution effectiveness. FCR is widely considered one of the most important contact center metrics because it correlates strongly with both customer satisfaction and operating cost. A contact that is resolved the first time does not generate a repeat contact — high FCR reduces volume while improving customer experience simultaneously.
Interpretation caution: FCR is difficult to measure accurately. The most reliable method is repeat contact tracking — identifying whether the same customer contacts again within a defined window (commonly 7 to 30 days) about the same issue. Agent self-reporting of FCR is less reliable because agents may mark contacts as resolved even when the issue recurs. Different measurement windows and methodologies produce different FCR numbers, which makes cross-organization benchmarking difficult. FCR in the voice channel is also distinct from "first contact resolution" in an omnichannel context, where the customer's journey may span multiple channels in a single resolution process. For a full treatment of how FCR is measured, how it compares to repeat contact rate, and why the two metrics can diverge, see first contact resolution vs repeat contact rate.
Occupancy
Definition: The percentage of logged-in time agents spend actively handling contacts versus waiting for the next contact.
Formula: Occupancy % = (Handle time ÷ Logged-in time) × 100
What it indicates: How efficiently agents' available time is being used. From a cost perspective, low occupancy means agents are spending time idle. From a wellbeing and quality perspective, very high occupancy means agents are moving immediately from one contact to the next without recovery time.
Interpretation caution: Very high sustained occupancy — above roughly 85–90% — is associated with increased error rates, agent fatigue, and elevated turnover. The relationship between occupancy and error rates is not mechanical; it varies by call type, team experience, and individual resilience. The risk threshold is not a single number that applies universally. Small teams see more occupancy variability than large teams at the same staffing level because random call arrival patterns are more pronounced with fewer agents — a small team can swing from 50% to 100% occupancy within minutes based on call clustering alone.
Agent utilization
Definition: Similar to occupancy but may include non-contact productive activities — training, coaching, quality review, administrative tasks — in addition to contact handling time.
What it indicates: How agents' overall scheduled time is being used across all productive activities, not just contacts.
Interpretation caution: The definition of utilization varies significantly across organizations. Some equate it with occupancy; others use it to describe the full picture of productive time usage. When comparing utilization figures, confirm what activities are included in the calculation.
Wrap-up time / After-Call Work (ACW)
Definition: The time agents spend on post-contact tasks after the interaction ends — updating CRM records, writing case notes, scheduling follow-up actions, completing dispositions.
What it indicates: ACW is a component of AHT and affects both agent occupancy and capacity. Long average ACW times suggest either that post-contact work is complex and necessary, or that CRM systems are slow or cumbersome, or that agents need additional training on documentation efficiency.
Interpretation caution: Reducing ACW time without addressing its root causes can reduce documentation quality, which creates downstream problems in CRM accuracy, repeat contact rates, and agent knowledge continuity. Reducing ACW by improving tool performance or streamlining workflows is generally better than reducing it by pressuring agents to complete notes faster.
Transfer rate
Definition: The percentage of answered contacts that are transferred to another agent, queue, or department after initial answer.
Formula: Transfer Rate % = (Transferred contacts ÷ Total answered contacts) × 100
What it indicates: Routing effectiveness and agent capability on the initial queue. High transfer rates indicate that contacts are arriving at agents who cannot or should not be handling them — either because routing is misconfigured, because agents lack the knowledge to resolve the contact type, or because contacts that should be handled elsewhere are reaching the wrong queue.
Interpretation caution: A transfer is not always a failure. Warm transfers between specialist teams in a multi-level operation are by design. The metric becomes a problem signal when transfers are occurring unexpectedly or at rates higher than the contact flow is designed for. See Call Routing Explained for routing design strategies that reduce unnecessary transfers.
CSAT (Customer Satisfaction Score)
CSAT measures post-interaction customer satisfaction via a survey rating question. Because CSAT measurement methodology, interpretation, and limitations are covered in depth elsewhere, this guide provides a summary reference only.
CSAT is distinct from operational efficiency metrics — it captures the customer's experience of the interaction rather than an internal process measure. A contact center can hit its service level and AHT targets on every call and still produce poor CSAT if agent communication quality, empathy, or resolution accuracy is low.
For the complete CSAT guide including formula, response rate considerations, bias, comparison to NPS and CES, and interpretation guidance, see What Is CSAT? For how to collect CSAT automatically in EaseDial and tie scores to call recordings for coaching, see EaseDial customer feedback tools.
How these metrics connect
Contact center metrics are not independent — they interact with and constrain each other in ways that make single-metric optimization dangerous.
| If you optimize only for... | You may inadvertently... |
|---|---|
| Lower AHT | Reduce FCR as agents rush to close calls rather than fully resolve them |
| Higher occupancy | Increase agent fatigue, ACW errors, and longer-term turnover |
| Higher CSAT | Increase AHT if agents spend more time on each call to ensure satisfaction |
| Lower abandonment rate | Increase staffing cost if achieved by hiring more agents rather than improving efficiency |
| Lower transfer rate | Reduce FCR if agents resolve issues outside their expertise poorly rather than transferring |
The test for any metric is whether improving it, in isolation, actually makes the operation better for customers and for the business. Usually, the answer is: only if other metrics stay constant or also improve. That is why balanced scorecards — tracking a set of related metrics together — produce better outcomes than targeting any single KPI.
EaseDial Analytics
Real-time supervisor views and historical KPI reports — built into the same platform as your queues and routing.
Building a metric structure that drives decisions
Not every metric belongs in every report. A useful way to organize contact center metrics is by the decisions they inform:
- Real-time operational metrics: Queue depth, agents available, in-interval service level, calls waiting. Visible to supervisors during their shift. Drive immediate intraday staffing decisions.
- Daily and weekly performance metrics: Service level, abandonment rate, AHT, transfer rate. Reviewed in team meetings. Drive coaching and operational adjustment conversations.
- Agent scorecards: Per-agent breakdown of FCR, CSAT, AHT, adherence, QA score. Reviewed individually with agents. Drive development and performance management.
- Strategic metrics: Volume trends by contact type, cost per contact, CSAT trend, capacity utilization. Reviewed monthly or quarterly by management. Drive headcount, routing, and technology investment decisions.
Each layer has different audiences and different decision horizons. Combining everything into a single dashboard typically means none of the views serve their audience well.
Frequently Asked Questions
Free calculators for the KPIs in this guide: Cost-Per-Call · FCR · Occupancy · SLA Breach Risk · ACW Cost — no email required.
For the analytics platform context — how to organize reporting, build dashboards, and connect metrics to decisions — see Contact Center Analytics. For CSAT in full detail, see What Is CSAT?. For the forecasting and scheduling processes that drive service level outcomes, see Call Center Forecasting and Scheduling.