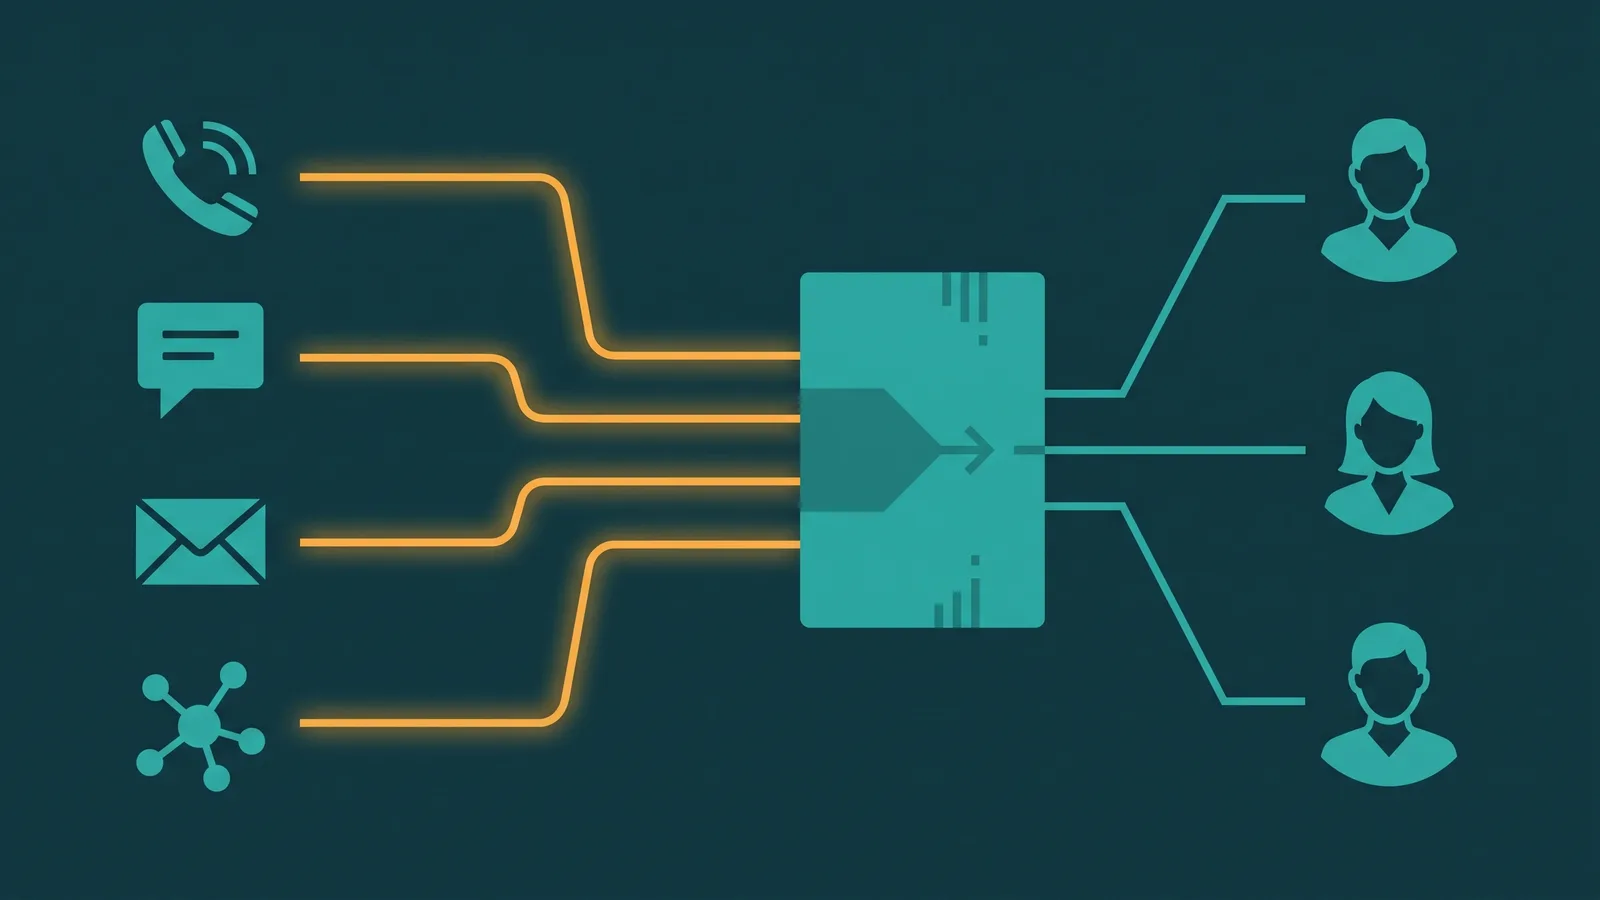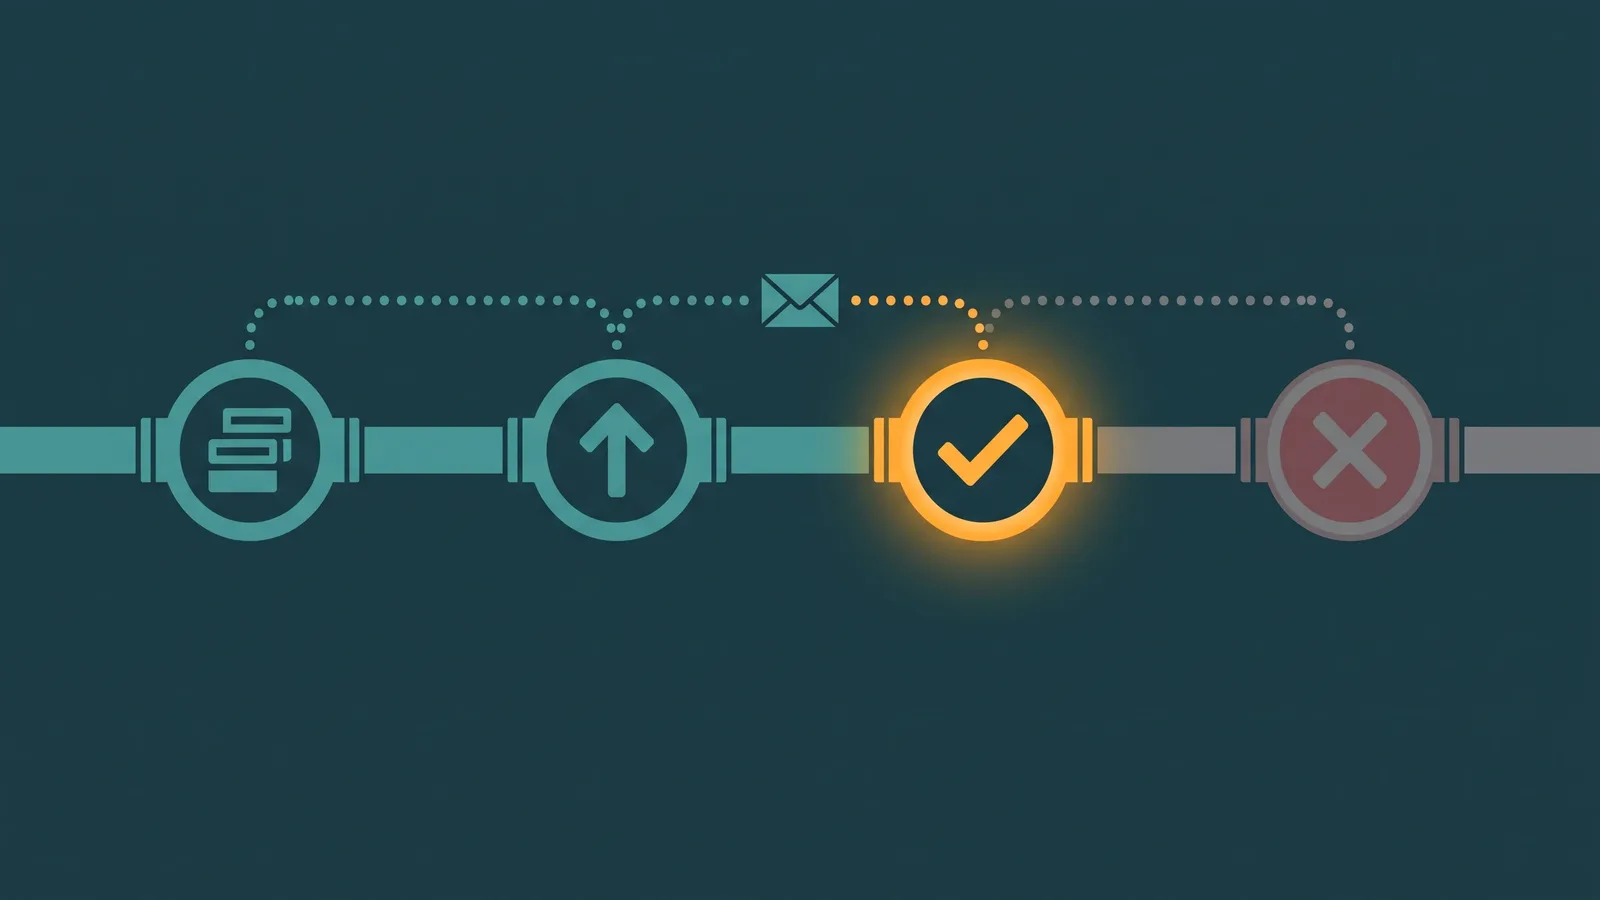
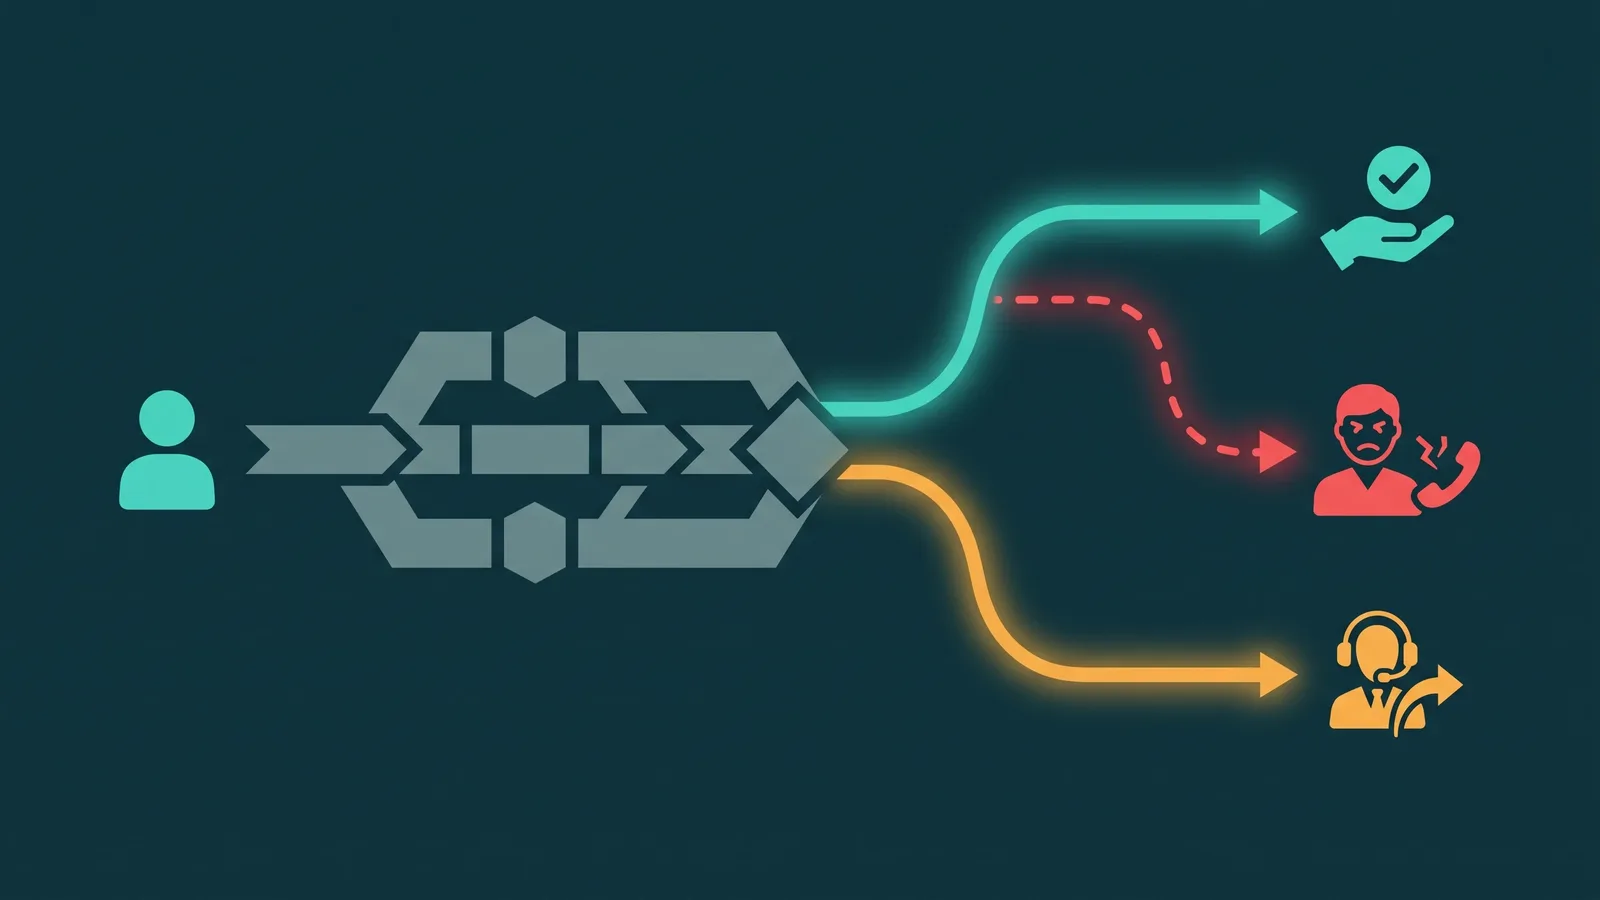
IVR containment rate is one of the most watched metrics in contact center operations and one of the most frequently misread. A rising containment rate gets reported as a win. But unless you know why calls are being contained — completed task, frustrated hang-up, blocked transfer, or forced deflection — the number tells you almost nothing about whether your IVR system is actually working for callers.
This article covers what containment rate measures, four ways it gets inflated without reflecting real self-service success, how to measure it more accurately, how denominator choice changes the number, how it differs from deflection and self-service rate, what drives it, and how to improve it.
IVR containment rate formula:
Containment Rate = (Calls completed in IVR without agent transfer ÷ Total calls entering the IVR) × 100
A call is "contained" when the caller completes their interaction and disconnects without ever reaching a live agent. Typical ranges: 30–40% for a newly deployed IVR; 50–70% for a mature, well-designed system with broad task coverage. AI-powered conversational IVRs (IVAs) often start at 25–40% and improve with tuning.
Why Containment Rate Is Often Misleading
The core problem with raw containment rate is that it treats every non-transfer call as equivalent. A caller who checked their account balance and hung up satisfied is "contained." A caller who couldn't find the option they needed, gave up, and hung up in frustration is also "contained." The metric doesn't distinguish between them. Four specific scenarios inflate containment without reflecting genuine self-service success:
1. Frustrated Hang-Ups Counted as Contained
This is the most common inflation problem. A caller enters the IVR, navigates through two or three menu levels without finding what they need, and hangs up. No agent was involved, so the call counts as contained. In reality, the caller failed to get help, will likely call back (or contact another channel), and left with a negative impression of your service.
Frustrated hang-ups are particularly common when IVR menus are built around the company's internal organizational structure rather than how callers think about their problem. A caller with a billing dispute who hears "Press 3 for the Accounts Receivable department" may not recognize that as their option and abandon instead. The IVR contains the call; the caller's task is not resolved.
2. Authentication Failures Counted as Contained
Many IVRs require authentication before accessing account information — PIN entry, voice biometrics, or security question verification. When a caller fails authentication, either because they don't remember their PIN or because voice biometric matching fails on a noisy line, and they subsequently abandon the call rather than wait for an agent, that call is contained. The caller got nothing. Authentication friction is a meaningful source of containment inflation in any IVR that secures account-level self-service tasks.
3. Forced Deflection When Agents Are Unavailable
When agent queues are full or outside business hours, some IVR configurations prevent the caller from transferring even if they request an agent. The system plays a message — "all agents are currently busy, please call back during business hours" or "you can reach us at our website" — and ends the call. Technically contained. Not self-served. The caller was blocked from reaching a human and received no resolution. This type of containment is the most operationally misleading because it inflates the metric precisely when the contact center is most stressed.
4. Task-Level Incompleteness
A call can be contained even when the caller's actual task was not completed. If a caller asks the IVR to update their billing address and the IVR responds with "please visit our website to make account changes," the call is contained — no agent transfer happened — but the caller's intent was not fulfilled. The task was deflected to another channel rather than completed. This is common in IVRs that handle informational tasks well but cannot perform transactional ones.
Taken together, these four scenarios mean that raw containment rate can be a reasonable 50% while successful self-service is actually far lower. The metric rewards keeping callers out of queues rather than actually serving them.
Worked example: Two IVRs both report a 55% containment rate on 10,000 calls — meaning 5,500 calls did not reach an agent. In IVR A, 4,800 of those 5,500 callers completed their task (balance inquiry, payment, order status) and did not call back within 48 hours. Effective self-service rate: 48%. In IVR B, only 2,200 of the 5,500 contained callers completed their task without calling back; the other 3,300 either hung up in frustration or were blocked from reaching an agent during peak overflow. Effective self-service rate: 22%. Same raw containment rate; very different operational reality.
Better Ways to Measure IVR Containment
Three measurement approaches produce a more accurate picture of self-service performance:
Successful Containment Rate
Successful containment rate filters the denominator to include only calls where the caller did not contact you again within a defined observation window — typically 24–48 hours for transactional tasks, up to 7 days for more complex ones. The logic: if a caller who was "contained" calls back within 48 hours, their containment was not a success. They either failed to resolve their task or were frustrated enough to try again through a different path.
This requires linking contact records by caller ID or customer identifier across contacts. It is more operationally demanding than tracking raw containment, but it converts the metric from "calls that didn't reach an agent" to "calls that didn't reach an agent and didn't need to." This is a meaningfully different and more useful number.
Task Completion Rate
Rather than measuring overall containment as a single aggregate number, task completion rate measures self-service success at the individual task level. For each task type the IVR is designed to handle — balance inquiry, payment processing, order status, PIN reset — what percentage of callers who attempted that task completed it without agent intervention?
Task-level measurement immediately surfaces which self-service flows are working and which are failing. A payment task might have an 85% completion rate while an address change task has a 30% completion rate. The aggregate containment number obscures this. See contact center analytics for how task-level IVR data fits into a broader measurement framework.
Repeat Contact Filter
The repeat contact filter is a retroactive reclassification method. Calls initially recorded as contained are reclassified as failures if the same customer contacts the center again within the observation window about the same issue. When applied consistently, this converts a raw containment number into something closer to effective containment. It requires a customer identification layer — either ANI matching, CRM record linking, or account lookup — and consistent issue categorization across contacts to confirm they are related.
None of these approaches requires abandoning the raw containment metric. The most useful practice is to track raw containment alongside successful containment or task completion rate so that discrepancies between the two — which indicate frustrated hang-ups, authentication failures, or forced deflections — become visible.
Denominator Choices and How They Change the Number
The denominator used to calculate containment rate has a larger effect on the resulting number than most teams realize. Four common denominator definitions are in use across the industry, and they produce materially different results from the same underlying call data:
| Denominator Definition | What It Excludes | Effect on Containment Rate |
|---|---|---|
| All calls entering the IVR | Nothing — includes immediate hang-ups, misdials | Lowest number; most conservative |
| Calls that navigated past the greeting | Callers who hung up before hearing any options | Higher than all-calls; removes trivial abandons |
| Calls that attempted a self-service task | All callers who pressed 0 or said "agent" immediately | Higher still; measures only callers who tried self-service |
| Authenticated calls only | Callers who failed or skipped authentication | Highest; measures post-authentication task completion |
None of these definitions is universally correct. Each answers a different question. The all-calls denominator answers: "Of every caller who reached our IVR, how many never transferred to an agent?" The attempted-task denominator answers: "Of callers who tried to use self-service, how many succeeded?" These are both legitimate questions but they are not the same question, and they produce different numbers.
The practical problem arises when organizations compare their containment rate to benchmarks or to a previous period without confirming that the denominator definition is consistent. A vendor reporting 65% containment may be using the attempted-task denominator; your internal report showing 45% may be using all-calls entering the IVR. The gap is definitional, not performance-based.
Document your denominator definition, apply it consistently over time, and confirm the same definition is being used whenever you compare to external benchmarks or vendor claims.
IVR Containment vs Deflection vs Self-Service Rate
These three terms are often used interchangeably in vendor materials and industry reporting. They are not the same thing:
Containment rate is measured from the IVR's perspective. It counts calls that entered the IVR and did not transfer to a live agent, regardless of how that call ended. It is purely about what happened within the voice channel.
Deflection rate is sometimes used synonymously with containment, but its more precise meaning refers to calls that were redirected from the voice channel to a different channel — SMS, web, app, chatbot — rather than completed within the IVR itself. A caller who gets a text message with a tracking link instead of reaching an agent was "deflected," not "contained" in the traditional sense. The distinction matters if you are measuring the IVR's self-service performance separately from your omnichannel digital channel performance.
Self-service rate is a broader metric that spans all channels. It measures the percentage of total contacts — voice, chat, email, web — that are resolved without a live agent. An IVR containment rate of 55% combined with a web self-service resolution rate of 70% and a chatbot resolution rate of 60% contributes to an overall self-service rate that no single channel-level metric captures. Self-service rate is more useful for strategic capacity planning; containment rate is more useful for IVR-specific optimization.
When evaluating a CCaaS platform's reporting on these metrics, always ask: what is the exact formula, what is the denominator, and does "deflection" include digital channel redirects or only IVR completion without transfer? The same label frequently describes different calculations in different platforms.
What Drives Containment Rate
Four factors account for most of the variation in IVR containment rate across deployments:
Task Coverage
The most fundamental driver. An IVR can only contain calls for tasks it is designed to handle. Balance inquiry, payment processing, order status, and appointment scheduling are tasks that typically contain well — they are transactional, have clear success states, and can be completed without human judgment. Complex billing disputes, complaint escalations, and exception handling do not contain because they require agent discretion.
Expanding the set of tasks the IVR can resolve is the most direct lever for increasing containment. This is not about squeezing more out of existing flows — it is about adding new task types that callers currently need to reach an agent for. Task coverage analysis (which call types generate the most agent transfers?) identifies where adding self-service capacity would have the largest impact.
Recognition Accuracy
For speech-enabled IVRs, recognition failure drives transfers. When the system cannot understand what the caller said — due to background noise, accent variation, complex phrasing, or poorly tuned speech models — callers either repeat themselves until they give up, or press 0 for an agent. DTMF menus avoid this problem entirely (near-100% recognition rate) but at the cost of task complexity and caller experience. Conversational IVRs and IVA systems achieve higher task coverage but require ongoing model tuning to maintain recognition accuracy across diverse caller populations.
Monitoring no-match and no-input events at the prompt level reveals which specific moments in your IVR flows are causing recognition failures and driving agent transfers. See IVR best practices for detailed guidance on prompt design and recognition optimization.
Menu Design and Depth
Menu structure affects containment through caller abandonment. Menus with more than four or five options per level, menus built around internal org structures rather than caller intent, and menus that bury common call reasons deep in sub-menus all increase the rate at which callers abandon self-service before completing their task. The abandonment happens because the caller cannot find their option, not because the IVR couldn't serve them if they had found it. These callers register as contained (they hung up without transferring) but were not self-served.
Authentication Design
Authentication friction is a direct tax on containment for any IVR that handles account-level tasks. Long PIN sequences, multi-factor authentication with no fallback path, and voice biometric enrollment requirements all increase the probability that callers abandon self-service at the authentication step. Authentication should be proportionate to the task's sensitivity. Balance inquiry requires less authentication friction than initiating a payment or changing contact information. Tiered authentication — lighter friction for read-only tasks, stronger verification for account changes — generally produces better containment than a single authentication gate for all tasks.
How to Improve Containment Rate
Step 1: Audit Exit Points
Before attempting to improve containment, understand where calls are leaving the IVR and why. Task-level exit data — which IVR paths most frequently end in agent transfer requests — shows you exactly where self-service is failing. The exits divide into three categories: callers who found the self-service path and completed their task (good), callers who found the self-service path but hit an error or recognition failure (improvable), and callers who couldn't find the path and requested an agent (routing/menu problem). Each category requires a different fix. Without this segmentation, containment improvement efforts target the wrong things.
Step 2: Add Task Coverage
For the call types that are currently exiting to an agent because the IVR has no self-service path for them, the question is whether a self-service path is feasible. Not every call type is containable — some require agent judgment by their nature. But many contact centers have ten or fifteen task types generating meaningful agent handle volume where self-service is technically feasible and simply has not been built yet. Prioritize by volume: the task types that account for the most agent minutes are where adding self-service coverage has the largest operational impact.
Step 3: Improve Recognition and Prompt Design
For call types that have self-service paths but high mid-flow exit rates, the problem is usually recognition accuracy or prompt design. Analyze no-match events at the prompt level. Simplify open-ended inputs where possible — "say your account number" generates more recognition failures than "please enter your account number on your keypad." Tune speech models on your caller population's language patterns if your platform supports it. Add clear reprompt and fallback handling so that callers who encounter one recognition failure don't immediately transfer — most will succeed on a second attempt with a simpler prompt.
Step 4: Separate Good Containment from Bad
Implement the repeat contact filter or successful containment measurement described above. Once you can distinguish contained calls that did not generate a repeat contact from those that did, you have a feedback loop that tells you whether your containment improvement efforts are producing genuine self-service success or just more frustrated hang-ups. This is the measurement change that converts containment from a metric that rewards keeping callers out of queues into one that rewards actually serving them.
Frequently Asked Questions
The Bottom Line
IVR containment rate is a useful operational metric but a poor measure of self-service quality on its own. Its numerator captures everything from genuine task completions to frustrated hang-ups to callers who were blocked from reaching an agent. Without separating those categories, a rising containment number can mean things are getting better or getting worse.
The measurement upgrades that make containment meaningful — successful containment with a repeat contact filter, task-level completion rates, and consistent denominator documentation — are not technically complex. They require linking contact records across interactions and segmenting exit types. Most contact center platforms already capture the data needed; the gap is usually in how the data is structured and queried rather than what is collected.
For the IVR design principles that directly affect which calls can be contained, see IVR best practices. For the broader analytics structure that IVR containment data fits into, see contact center analytics. For how IVR fits into the technology stack, see the IVR system guide.