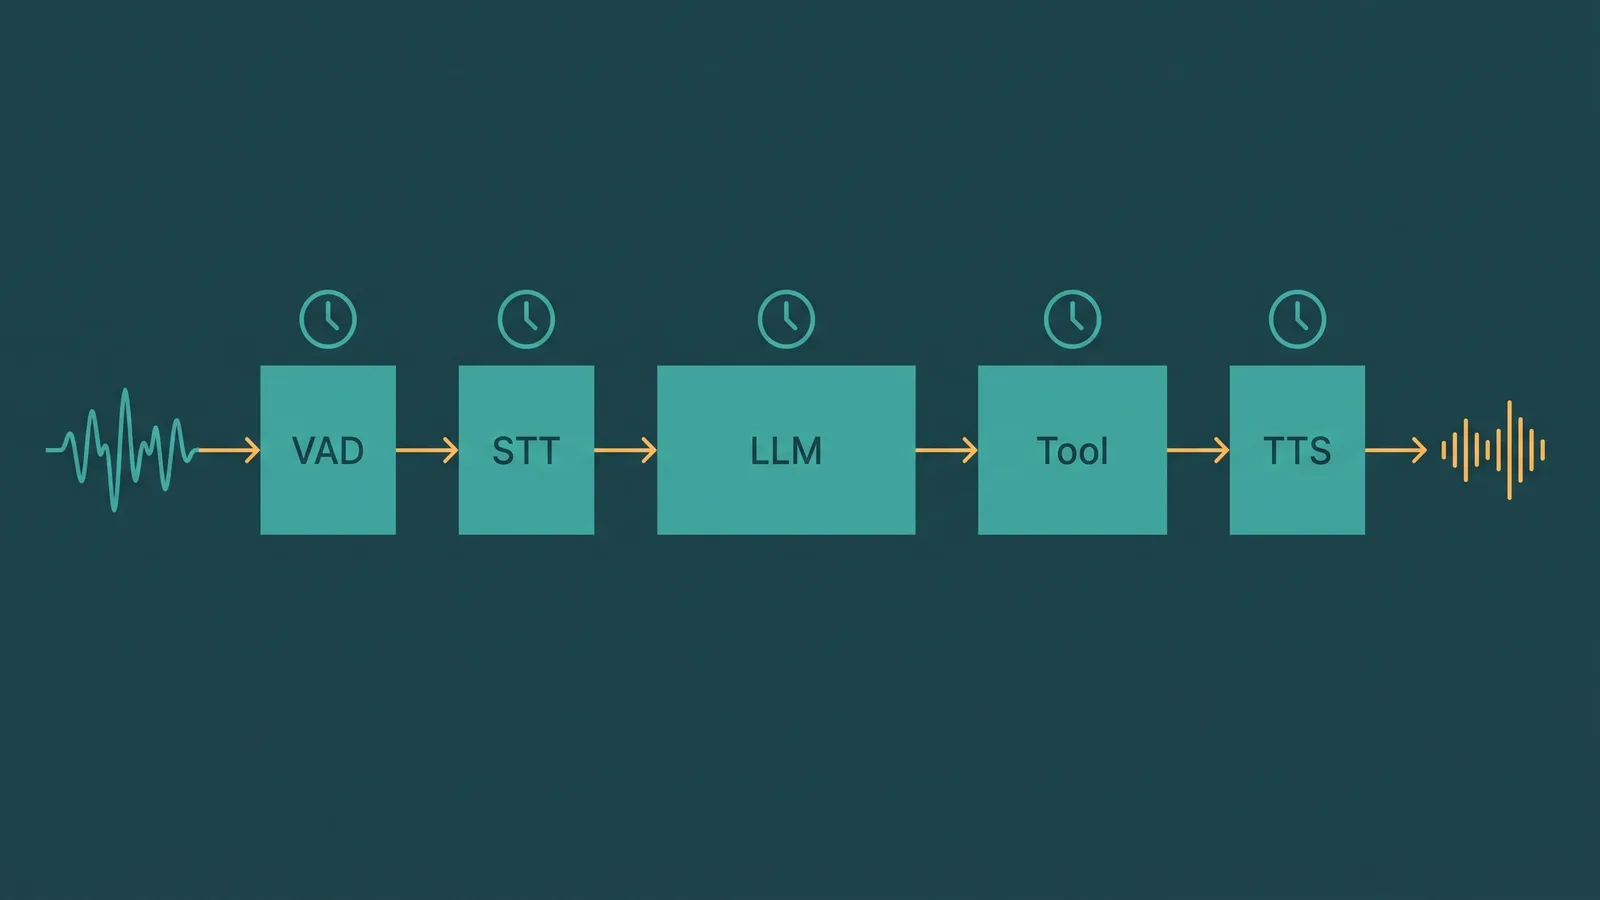
When a caller speaks to an AI voice agent, they expect a response within the same beat they would get from a human. But an AI voice agent is not a single process — it is a chain of seven distinct stages, each of which adds delay. Understanding where that delay accumulates, and how to measure it at each stage, is the difference between a conversational experience and one that sounds like a satellite call with awkward pauses.
This guide breaks down the full AI voice agent latency pipeline, explains what callers actually perceive, and sets out a measurement approach that goes beyond single-call averages to the percentile data that reflects real-world performance under load.
The Seven Stages of AI Voice Agent Latency
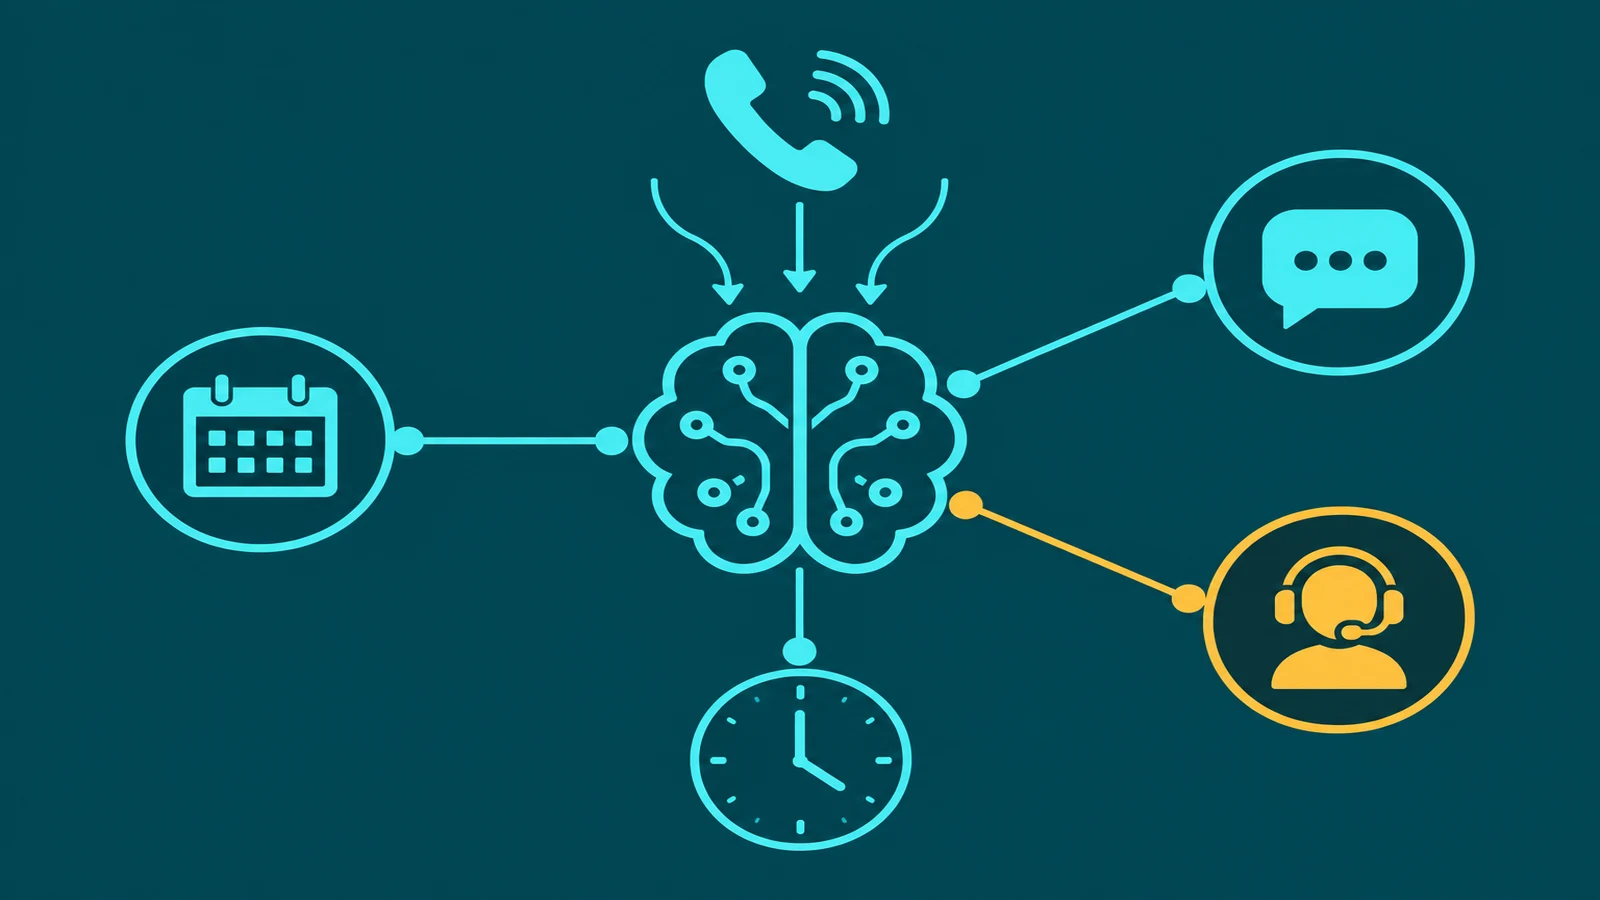
Latency in an AI voice agent is not a single number. It is the sum of every stage from the moment the caller finishes speaking to the moment they hear the first syllable of the AI's response. Each stage can be measured, monitored, and optimized independently.
| Stage | What It Does | Typical Contribution | Primary Optimization |
|---|---|---|---|
| Transport | Audio travels from caller's phone to processing infrastructure | ~20ms PSTN; variable VoIP RTT | Regional infrastructure co-location |
| VAD | Detects end of caller utterance via silence threshold | 200–700ms (configurable silence window) | Tune threshold to call type |
| STT | Converts caller speech to text transcript | 100–500ms depending on utterance length | Streaming STT; closest regional endpoint |
| LLM inference | Processes transcript and generates response tokens | Varies by model size, prompt length, response length | Minimize TTFT; stream output; right-size model |
| Tool calls | LLM queries external APIs (calendar, CRM, etc.) | 300ms–2s+ per call; compounds when sequential | Consolidate tools; cache frequent responses |
| TTS | Converts response text to audio for playback | Reduced to first-sentence latency with streaming TTS | Streaming TTS; closest regional endpoint |
| Playback | Audio delivered back to caller's handset | Negligible additional delay at this stage | Network quality at caller location |
Stage 1 and 2: Transport and VAD
The first two stages are often overlooked because they happen before any AI processing begins. Transport latency covers the time for caller audio to travel from their phone to the platform's processing infrastructure. PSTN introduces roughly 20ms of inherent delay; VoIP round-trip time varies based on geographic distance to the processing cluster and local network conditions. This is why co-locating processing infrastructure with the caller's region matters — not just for quality but for the total latency budget. For more on how the network layer affects voice, see our guide to VoIP call quality.
VAD — Voice Activity Detection — is where many teams are surprised to find a deliberate, configurable delay built into the system. VAD detects that the caller has finished speaking by waiting for a window of trailing silence before triggering downstream processing. This silence threshold is typically set between 200ms and 700ms, depending on the system configuration. Set it too short and the AI interrupts callers mid-sentence. Set it too long and callers hear a pause before anything begins. VAD latency is not a bug — it is an intentional design parameter that must be tuned for the specific use case.
Stage 3: Speech-to-Text
Real-time call transcription via a streaming STT engine is a key latency lever. Batch STT waits for the full utterance audio to be delivered before transcribing — this adds the full utterance duration plus transcription processing time before the LLM can begin. Streaming STT processes the audio word-by-word as it arrives, which reduces the time between VAD trigger and transcript availability, though it can also introduce partial-transcript errors on words that are still being spoken.
Production STT latency typically falls in the 100–500ms range depending on utterance length and the model being used. Shorter utterances are cheaper; longer, more complex utterances take longer both to capture and to transcribe. Using the closest regional endpoint for STT — rather than routing audio across continents — meaningfully reduces the RTT component of that window.
Stage 4: LLM Inference
LLM inference is usually the most variable stage in the pipeline. The key metric here is not total generation time — it is Time to First Token (TTFT): how long the model takes to begin generating a response. Because streaming output starts as soon as the first token is produced, TTFT determines how quickly TTS can begin, which is the primary driver of when the caller hears anything.
Several factors affect TTFT:
- Model size: Smaller, faster models produce first tokens sooner. Larger models have higher reasoning capability but greater inference latency.
- Prompt length: Longer system prompts, conversation history, and retrieved context all increase the amount of input the model must process before generating output.
- Response length: A response that requires more tokens takes longer to generate — and longer to synthesize through TTS.
- Infrastructure: Shared GPU inference has higher and more variable latency than dedicated capacity. Proximity to the inference cluster matters, as does queue depth under concurrent load.
A well-designed AI voice agent uses the smallest model that is accurate for a given intent class, reserves larger models for complex reasoning tasks, and keeps system prompts as lean as the use case allows.
Stage 5: Tool Calls
Tool calls are the single largest source of unpredictable latency in AI voice agents. When the LLM determines it needs to consult an external API — checking a calendar, querying a CRM, looking up order status — it must pause generation, make an HTTP request to the tool, wait for a response, and then resume inference. Each tool call can add 300ms to 2 seconds or more depending on the API's response time. Sequential tool calls compound: two tool calls each taking 500ms add a full second of additional delay before the caller hears anything.
If your AI voice agent regularly makes two or more sequential tool calls per turn, total latency can easily exceed 3 seconds from end of caller utterance to first audio — a range where callers frequently speak again or assume the line has gone silent.
Stage 6: Text-to-Speech
TTS converts the LLM's generated text into audio. Non-streaming TTS waits for the entire response text to be finalized before synthesis begins, meaning callers wait for both full generation and full synthesis before hearing anything. Streaming TTS starts synthesizing the first sentence as soon as it is produced by the LLM, and begins delivering audio to the caller while later sentences are still being generated. For voice applications, streaming TTS is essentially standard in production systems because of the direct impact on perceived latency.
As with STT, regional endpoint proximity matters. TTS synthesis adds its own network RTT, and routing audio synthesis through a distant data center adds unnecessary delay.
What Callers Actually Perceive
Latency is not experienced the same way by every caller, and individual tolerance varies. That said, UX research provides useful perceptual reference points:
- Under ~500ms: Feels natural — comparable to human phone conversation delay, including PSTN round-trip.
- 500ms–1.2s: Acceptable for an AI interaction. Callers who expect to be talking to an AI system generally accommodate a slight pause.
- 1.2s–2s: Noticeably slow. Some callers interpret this as dead air — a sign that the call has dropped or the system has stalled.
- 2s+: A substantial portion of callers will either speak again (triggering barge-in) or assume disconnection. At this range, the interaction degrades materially.
These are perceptual characterizations from user experience research, not a universal formula — caller context, the nature of the task, and prior experience with AI voice systems all affect individual tolerance. But they provide a useful frame for setting latency targets and evaluating whether optimization work is having a meaningful effect on the interaction.
A well-tuned production AI voice agent without tool calls can realistically achieve a Time to First Response (TTFR) in the 600ms–1.2s range from end of caller utterance to first audio. With one tool call, expect 1.5–3s. With sequential tool calls, 3–6s or more. These are general industry characterizations — actual results depend on system design, infrastructure, and traffic patterns.
Barge-In and Interruption Recovery
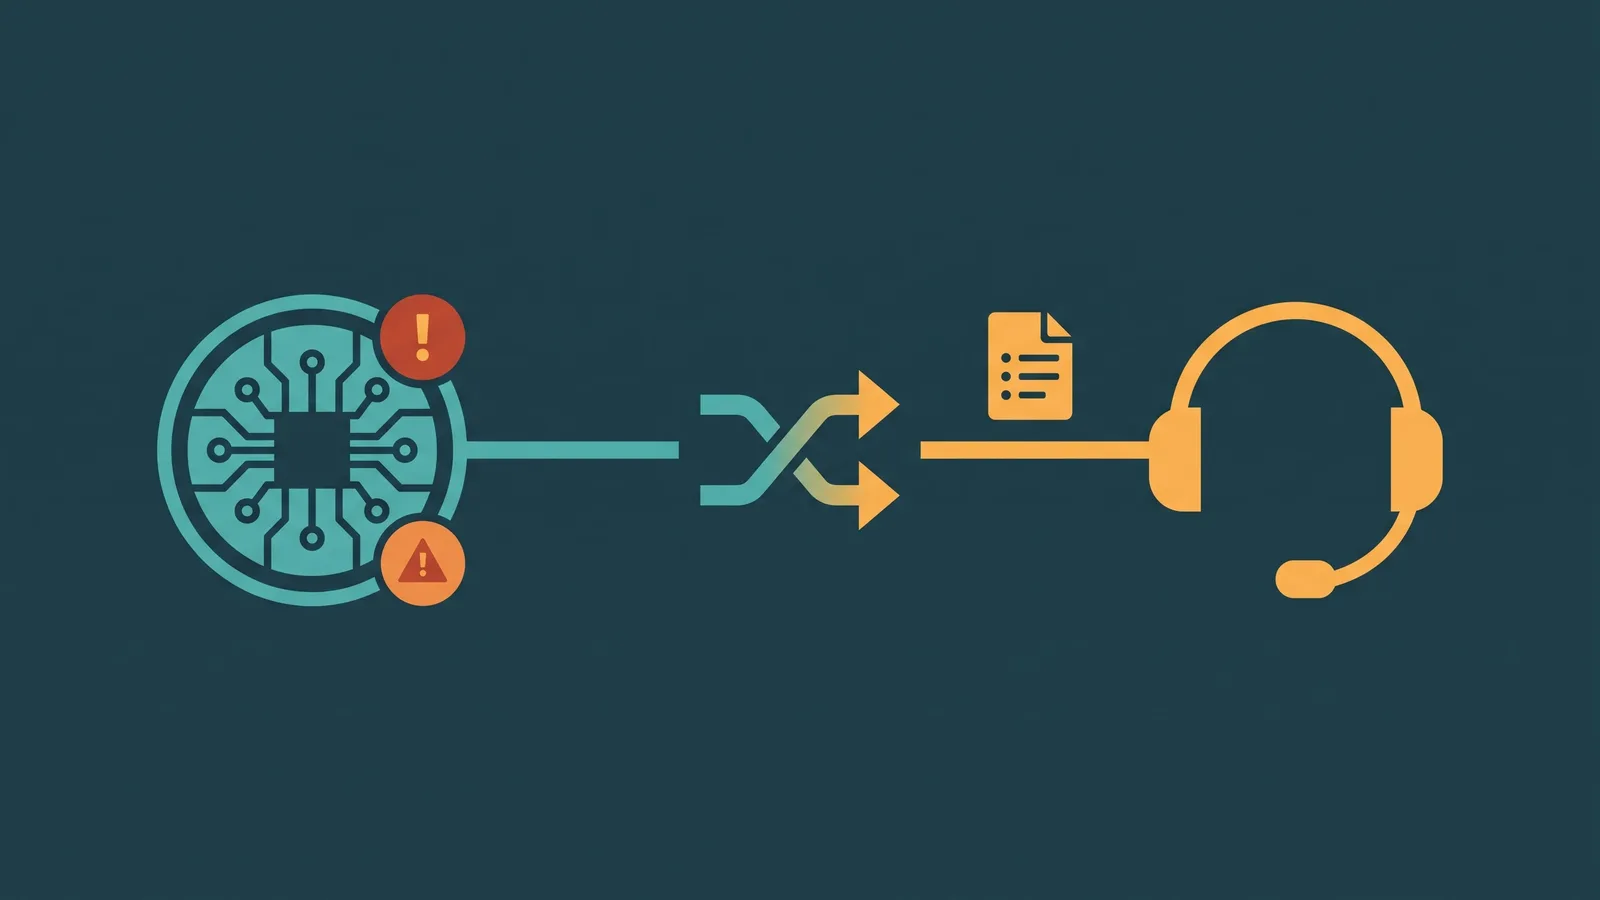
Barge-in is when a caller speaks while the AI is still delivering a response — either to correct the AI, answer a question faster, or because they grew impatient waiting. Handling barge-in correctly requires the system to detect the caller's voice via VAD, cut off in-flight TTS playback, discard the partially delivered response, and begin processing the new utterance from scratch.
This introduces a secondary latency event. The time between when barge-in is detected and when the caller hears a new response from the AI is effectively a full pipeline traversal: VAD trigger, STT, LLM inference (possibly with tool calls again), TTS, and playback. If the primary TTFR is slow, barge-in recovery latency will be similarly slow — and callers who barge-in are already frustrated by the first delay. Barge-in recovery latency should be measured and tracked as a separate metric in any production AI voice agent.
How to Measure AI Voice Agent Latency
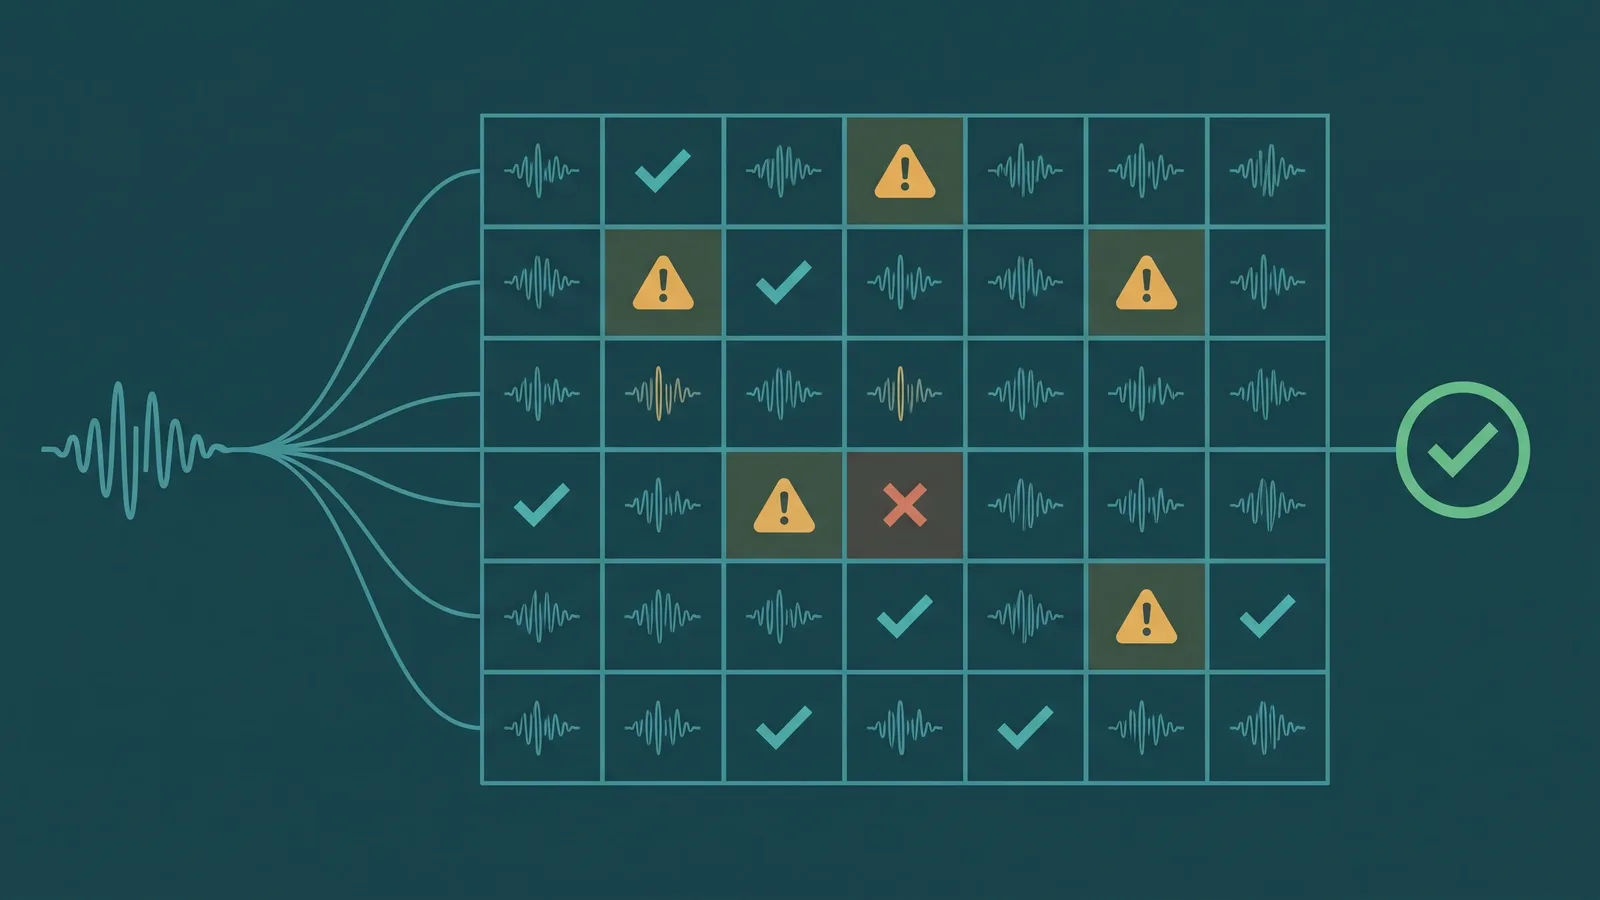
Average latency is a poor basis for evaluating AI voice agent performance. A fast median with a slow tail means a meaningful fraction of callers are having a bad experience — and those tail events are what drive abandonment and complaints. Measure at percentiles:
- p50 (median): The typical experience
- p90: The experience the top 10% of calls receive — the realistic floor for a "slow" call
- p99: The worst 1% — often where platform issues, cold starts, and API timeouts surface
The key metrics to instrument:
| Metric | What It Measures | Why It Matters |
|---|---|---|
| TTFR (Time to First Response) | End of utterance → first audio byte of AI response | The caller's primary perception of delay |
| TTFT (LLM Time to First Token) | STT completion → LLM first token generated | Isolates inference latency from transport and VAD |
| VAD trigger delay | Actual silence threshold being applied per turn | Confirms configuration and catches edge cases |
| Tool call latency | Per-tool API round-trip time, logged separately | Identifies which external dependency is the bottleneck |
| Barge-in recovery latency | Barge-in detection → first audio byte of new response | Catches the secondary delay that callers notice most |
One measurement trap to avoid: internal API logs alone do not capture the full caller experience. Transport latency — the time audio spends traveling to and from the platform — is part of what the caller experiences but is invisible from within the processing infrastructure. Measure from call recording timestamps or audio delivery events to get a number that reflects actual caller experience, not just processing time.
Load testing is also essential. A single-call latency baseline tells you very little about p90 or p99 under realistic concurrent load. Run load tests that reflect your expected peak concurrent call volumes, and measure percentiles under that load — not just at idle. Shared inference infrastructure in particular tends to show significant latency degradation at scale, which single-call testing will miss entirely.
Practical Optimization Priorities
Given the pipeline above, the highest-leverage optimizations roughly in order of impact are:
- Enable streaming TTS and streaming STT. Both reduce the time between pipeline stages completing and the next stage beginning, without changing model quality.
- Tune VAD silence threshold. Match it to the tempo of your specific call type. A fast-paced customer service flow needs a tighter threshold than a complex intake conversation.
- Reduce and cache tool calls. Every live API round-trip adds unpredictable latency. Cache slow-changing data and consolidate multi-step lookups.
- Right-size the LLM for each intent. Route simple, high-confidence intents to a faster, smaller model. Reserve larger models for cases where reasoning quality actually matters.
- Co-locate infrastructure regionally. STT, LLM inference, and TTS endpoints should all be in the same region as the processing cluster, and that cluster should be geographically close to the caller base.
- Keep system prompts concise. Prompt length directly affects inference latency. Every sentence of system prompt that is not load-bearing adds to TTFT.
Conclusion: Latency Is a Pipeline Problem
AI voice agent latency is not a single metric that a platform either clears or misses. It is the accumulated delay of seven distinct stages — transport, VAD, STT, LLM inference, tool calls, TTS, and playback — each of which contributes independently and can be measured, optimized, and monitored independently.
The practical ceiling for caller tolerance is roughly 1.2–2 seconds from end of utterance to first audio, and reaching the lower end of that range without tool calls is achievable with streaming STT, streaming TTS, well-tuned VAD, and appropriately sized inference. The challenge grows significantly once tool calls enter the picture: a single external API round-trip can double the total response time, and sequential tool calls can push it well beyond what feels conversational.
Start with measurement. Establish p50, p90, and p99 baselines for TTFR and for each stage in the pipeline, under realistic concurrent load. That data will tell you where your latency budget is actually going — and give you the evidence to confirm when optimization work is producing meaningful results for the callers on the other end of the line.
Frequently Asked Questions
What is a reasonable time-to-first-response target for a voice AI agent?
For simple acknowledgments or FAQ-style answers, aim for under 800 milliseconds. For responses that require a tool call (such as a database lookup), 1.5 to 3 seconds is typical. Anything above 2 seconds without a filler phrase (like "Let me check that for you") risks the caller assuming the line is dead.
How do you reduce latency when the AI needs to call an external API?
Cache frequent lookups, co-locate the API with the inference server to minimize network hops, and use streaming where the API supports it. If the call takes more than a second, play a brief filler phrase while waiting — this masks the latency without reducing it.
Does barge-in detection add latency to every response?
Barge-in detection runs continuously during AI playback, so it does not add latency to the initial response. However, when a barge-in is detected, the system must stop playback, process the new input through STT and the LLM, and generate a new response. This recovery cycle typically adds 200–600 milliseconds compared to a non-interrupted turn.