Service Level (SL) is the percentage of contacts answered within a defined time threshold. It is always expressed as two numbers: a percentage and a time — for example, "80% of calls answered within 20 seconds," written as 80/20. The threshold is fixed; SL tells you what fraction of callers beat it.
Average Speed of Answer (ASA) is the arithmetic mean wait time for all calls that were eventually answered — including both fast answers and slow ones. ASA is a single average across the entire distribution of wait times. Where SL counts callers above or below a line, ASA averages them all together.
Both metrics describe how quickly callers reach an agent, and both appear on virtually every contact center dashboard. The confusion arises because they look similar but behave very differently — and the distinction matters most when you are making staffing decisions, setting targets, or writing SLA contracts.
Service level vs ASA: comparison
| Dimension | Service Level | Average Speed of Answer |
|---|---|---|
| What it measures | % of calls answered within a defined threshold | Mean wait time across all answered calls |
| Affected by outliers | Less sensitive — outliers move the percentage only proportionally | Highly sensitive — a few very long waits can meaningfully raise the mean |
| Abandoned calls | Included in denominator (in the offered-based variant) | Excluded — only answered calls contribute |
| Erlang C input | Direct — you set the SL target and Erlang C outputs agent count | Indirect — must be converted to an SL equivalent first |
| Best used for | Staffing targets, SLA contracts, operational performance management | Supplemental reporting, trend analysis, executive summaries |
How service level is measured
The core formula is straightforward:
SL % = (Calls Answered Within Threshold / Total Calls Offered) × 100
The complication is the denominator. Two variants exist in widespread use:
- Variant 1 — Offered-based: The denominator includes all offered calls, including those that abandoned before reaching an agent. This produces a lower service level percentage because abandoned calls count against you even though you never had a chance to answer them.
- Variant 2 — Answered-based: The denominator includes only calls that were actually answered. Abandoned calls are excluded. This produces a higher service level percentage for the same raw call data.
Neither variant is universally correct — but whichever one you choose must be applied consistently. Mixing them across reporting periods destroys trend comparability. Document your definition explicitly, especially in any SLA contract where the number carries contractual weight.
The 80/20 target — 80% of calls answered within 20 seconds — is the most cited convention in the industry. It originated from AT&T research conducted in the 1980s on toll-free call handling and became embedded in contact center culture through repetition. It has no mathematical basis for being the "right" target. It is a convention, not a standard. An operation handling emergency triage calls, a hedge fund trading desk, and an outbound debt collection queue have very different appropriate targets — none of them necessarily 80/20.
How ASA is measured
ASA is simpler in formula, but its interpretation is more treacherous:
ASA = Total Wait Time for All Answered Calls / Total Answered Calls
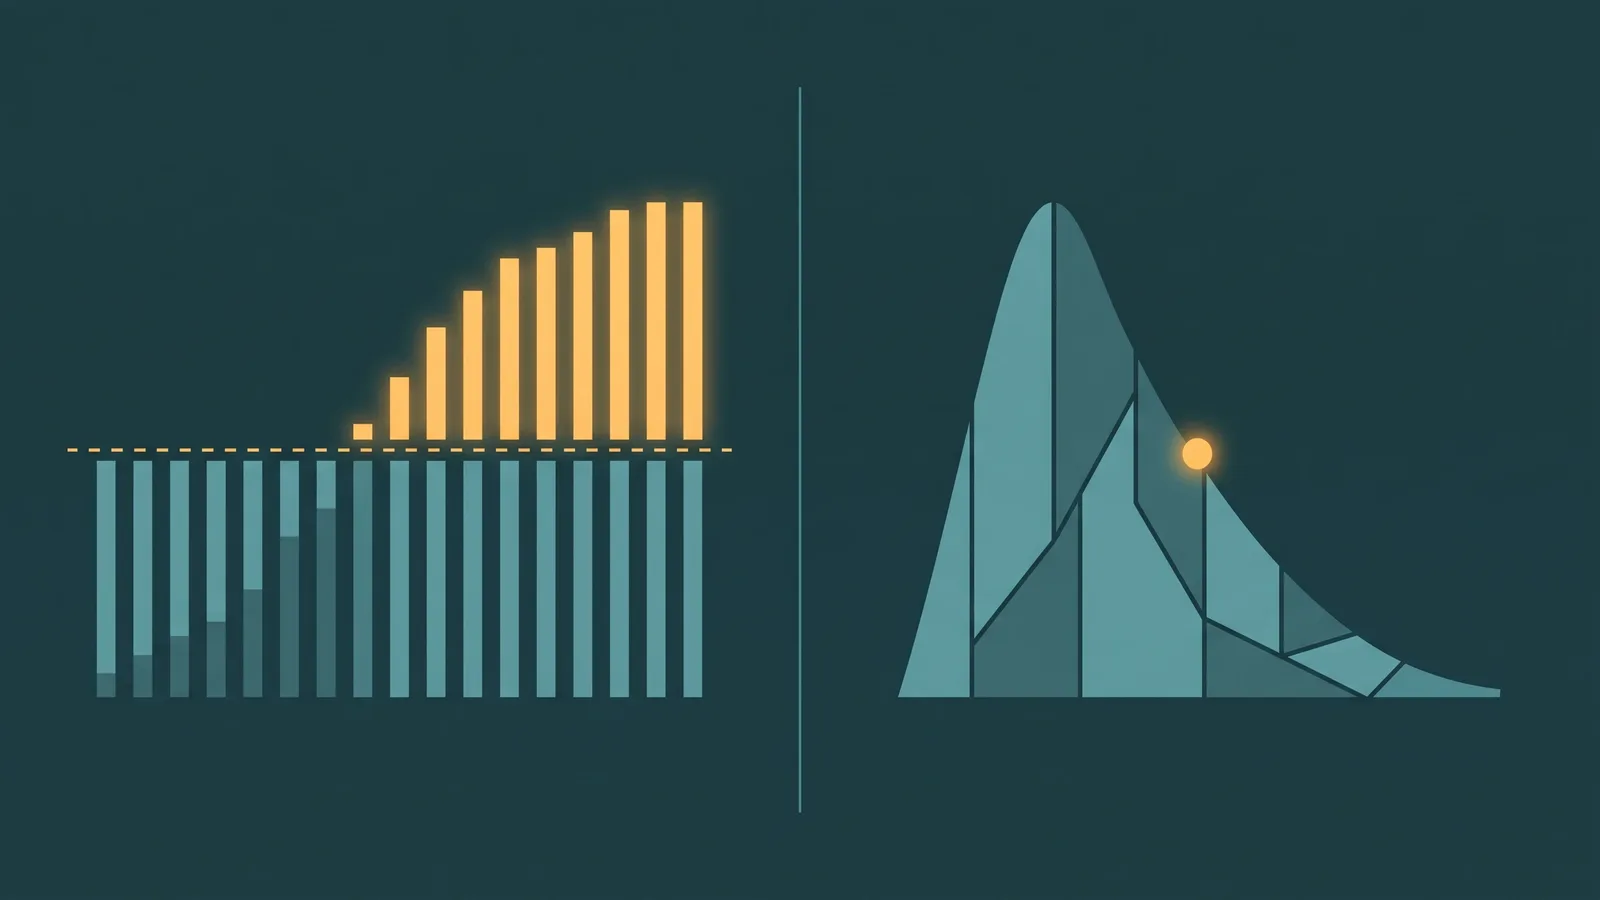
Because ASA is a mean, it is highly sensitive to outliers. A small number of callers who waited a very long time — say, 8 minutes each — will pull the average upward significantly even if the majority of callers waited only 15–20 seconds. An ASA of 45 seconds might reflect two very different underlying distributions:
- Distribution A: Most callers wait under 20 seconds, but a handful wait 5–8 minutes each. The mean is 45 seconds, but the median might be 16 seconds. Most callers had a fast experience; the average is misleading.
- Distribution B: Callers are roughly evenly distributed around 45 seconds — no extreme outliers, typical wait genuinely close to 45 seconds for most people.
You cannot distinguish these two situations from ASA alone. A 45-second ASA in Distribution A represents a fundamentally different staffing and caller-experience situation than a 45-second ASA in Distribution B. This is the core limitation of any mean applied to skewed data — and call wait time distributions are almost always right-skewed.
What service level reveals
Service level answers: "What fraction of callers get a fast answer?" SL is directly tied to the experience of most callers. If your SL is 82/20, you know that 82% of callers waited no more than 20 seconds before reaching an agent. The other 18% waited longer, but you know exactly where the line is and what percentage fell on each side of it.
Consider two queues with the same 20-second threshold:
- Queue A — 80/20 SL, ASA 12 seconds: Most callers are answered very quickly. A few wait considerably longer, but the large majority have a fast experience. The 12-second ASA reflects that the distribution is skewed toward fast answers.
- Queue B — 60/20 SL, ASA 30 seconds: Four in ten callers are waiting beyond 20 seconds. The average is pulled up accordingly. Many callers have what most people would consider a meaningfully long wait.
In Queue A, ASA of 12 seconds might suggest things are going very well — but the 20% of callers waiting longer than 20 seconds are having a quite different experience than the average suggests. SL makes that gap visible.
What ASA reveals
ASA answers: "On average, how long do callers wait?" ASA is a summary statistic influenced by outliers. It is harder to translate into what a typical caller experiences because the distribution is hidden inside the average.
In Queue B from the example above, the 30-second ASA communicates the problem more directly than the SL percentage alone might, because it captures the weight of long waits rather than just counting callers above a threshold.
In practice, the two metrics are most useful when read together rather than substituted for each other.
Abandoned calls and the ASA blind spot
Abandoned calls — callers who hang up before reaching an agent — do not contribute to ASA, because ASA only counts calls that were eventually answered. This creates a systematic bias that is easy to overlook.
When abandonment is high, ASA will look better than your actual customer experience warrants. Callers who abandoned after long waits never appear in the ASA numerator or denominator. The metric measures only the callers who stayed. If the longest-waiting callers are also the most likely to abandon — which they typically are — then ASA is calculated from a survivor sample that systematically excludes the worst experiences.
A scenario: your queue has 1,000 callers in a period. 150 abandon after waiting more than 90 seconds each. The remaining 850 are answered, with an average wait of 35 seconds. Your ASA is 35 seconds. But the 150 callers who left waited over 90 seconds each before giving up — their experience is completely absent from the metric.
This is why abandonment rate must always be tracked alongside SL and ASA, not treated as a separate concern. An operation with low ASA and high abandonment may be flattered by the ASA figure. Callers who could not tolerate the wait removed themselves from the calculation before it was made.
What neither metric tells you
Both service level and ASA describe how quickly callers reached an agent. Neither tells you what happened after connection: whether the issue was resolved, how the caller felt about the interaction, or how complex the contact was. First-contact resolution, CSAT, and AHT provide the outcome context that SL and ASA cannot.
Which to use for staffing
Service level is the correct metric to use as a staffing target, for a practical reason: Erlang C — the standard mathematical model used to calculate how many agents are needed to handle a given call volume — takes service level as a direct input. You specify the call volume, the average handle time, the threshold (in seconds), and the percentage of calls you want answered within that threshold, and Erlang C outputs the agent count required.
ASA cannot be used as a direct Erlang C input in the same way. You can calculate what ASA a given staffing level will produce, but you cannot start from an ASA target and derive an agent count without first converting it to an equivalent service level assumption. The conversion requires assumptions about the distribution of wait times, which reintroduces the very ambiguity that makes ASA harder to use in the first place.
For internal reporting and executive dashboards, SL is also cleaner to communicate. "We answered 84% of calls within 20 seconds this week" is immediately interpretable. "Our ASA was 28 seconds" requires more context — is that good or bad? Compared to what? Was that driven by a few very long waits or a uniform distribution?
ASA has legitimate uses in supplemental analysis: comparing performance across periods, identifying whether outlier waits are growing or shrinking, and understanding the average caller experience as a secondary data point. It is not the right primary staffing metric.
Industry conventions for SL targets
The 80/20 target is the most common convention across general contact center environments. It is not derived from any customer research specific to your operation — it is a default inherited from decades of industry practice. Other conventions appear in specific environments:
- 80/30 and 80/60: Used in lower-intensity environments, back-office support queues, or operations where callers are expected to tolerate longer waits — for example, some government or utility customer service lines.
- 90/10 or higher: Used in high-urgency environments such as emergency response lines, financial trading desks, or medical triage operations where fast answer is operationally critical and understaffing has serious consequences.
- Healthcare and government: Targets vary widely by context and regulatory requirement. There is no single convention that applies across the sector.
Any service level target should be set based on what callers in your specific context can tolerate, what the consequence of a long wait is, and what it costs you to hit each incremental improvement. Borrowing a target from a different industry or a conference presentation without calibrating it to your own context is a common and avoidable error. Tighter targets require more agents to hit — the staffing cost of moving from 80/20 to 90/10 can be substantial.
Frequently Asked Questions
Use our free SLA Breach Risk Calculator to see if your current staffing will meet your service level target — powered by the Erlang C formula. No email required.
Understanding the difference between service level and ASA is foundational for any contact center manager working with staffing models or SLA commitments. For the broader set of metrics these sit alongside, see Call Center Metrics and KPIs Explained. For how service level targets flow into schedule design and headcount calculations, see Call Center Workforce Management and Call Center Forecasting and Scheduling.