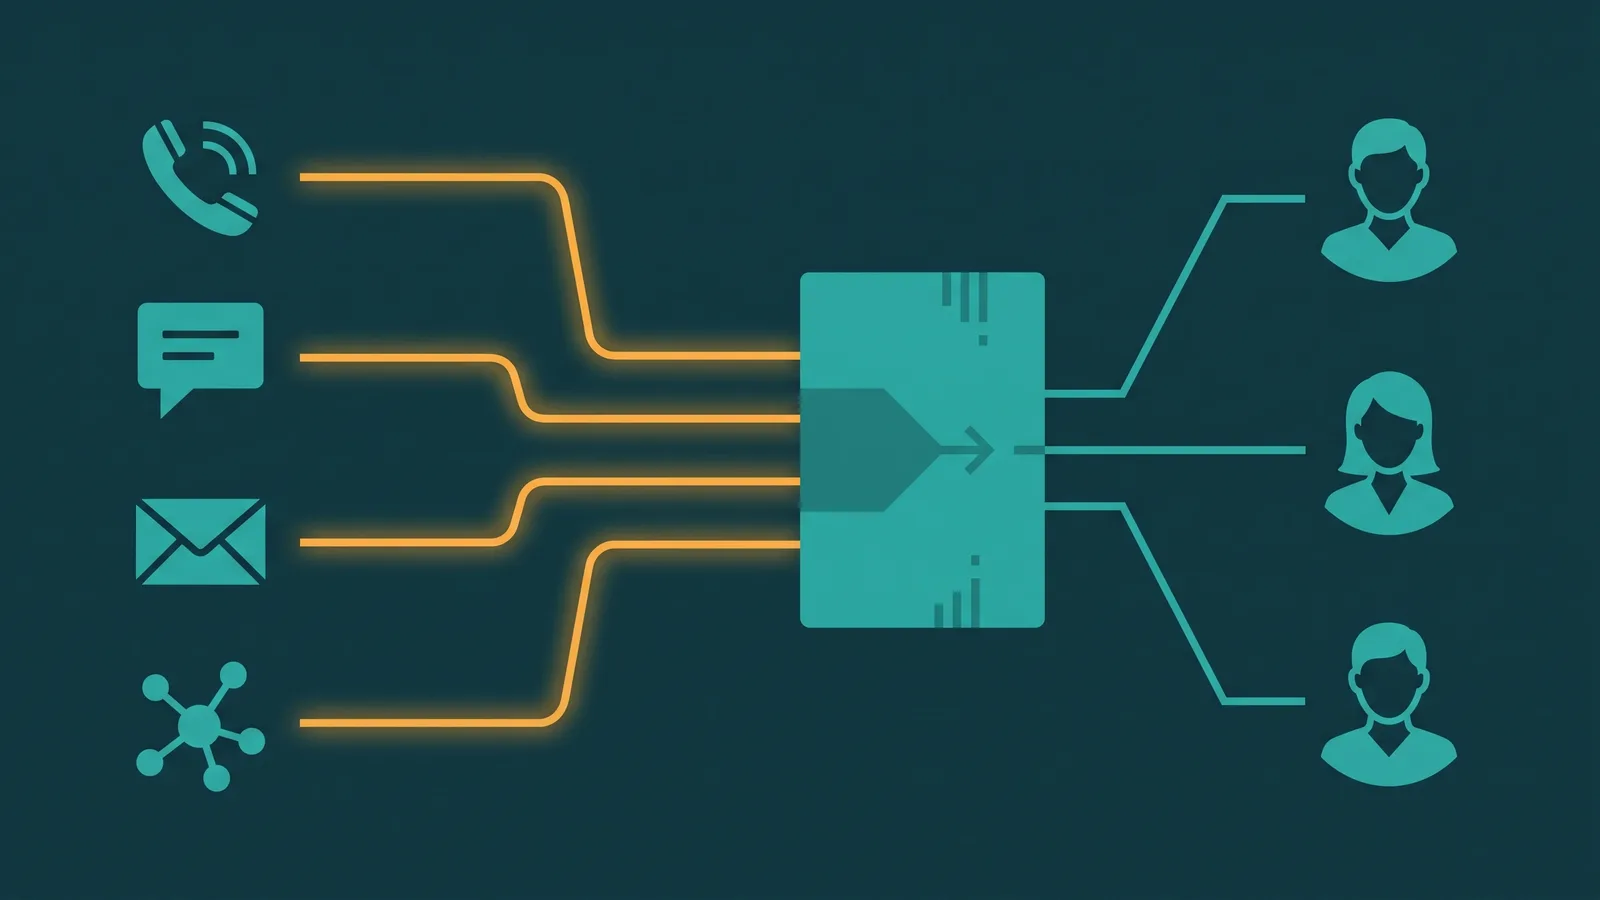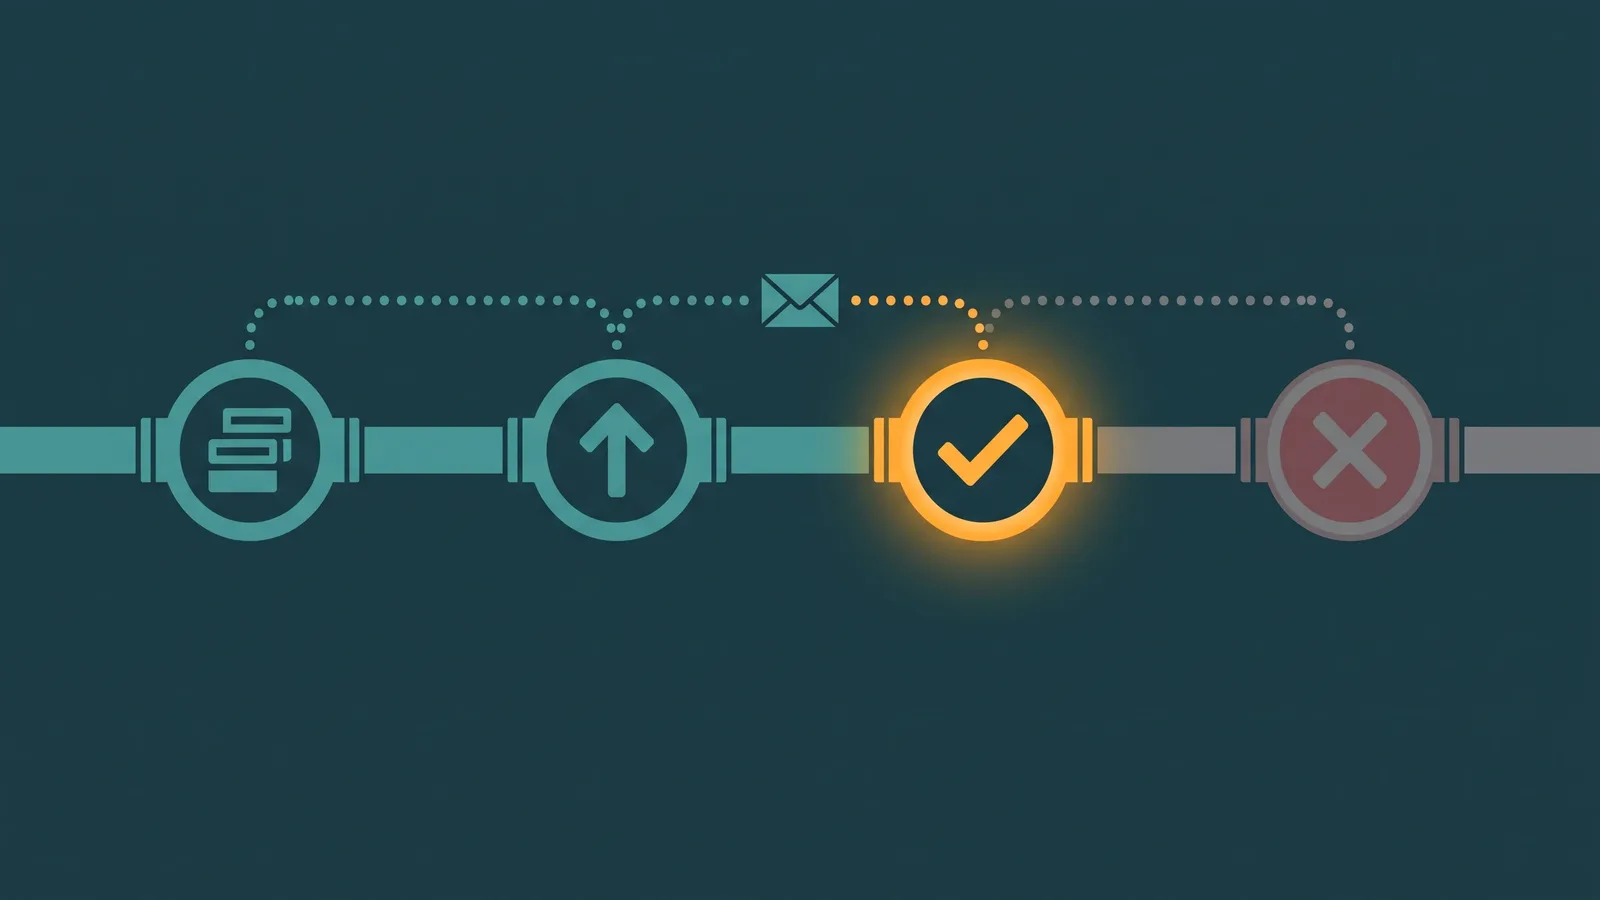

When abandonment rate climbs, the instinct in many contact centers is to look at agents — were they handling calls too slowly, taking too many breaks, wrapping up too long? That is almost always the wrong diagnosis. High abandonment is nearly always a queue problem: callers waited longer than they were willing to wait, and they hung up. The fix lives in staffing levels, call center forecasting, call queue design, and intraday management — not in agent coaching. Understanding that distinction before pulling any levers will save your team significant misdirected effort.
Call abandonment rate is the percentage of inbound callers who disconnect before reaching an agent. The formula is:
Abandonment Rate = (Abandoned Calls / Total Inbound Calls) × 100
Most platforms apply a short-abandon exclusion — callers who disconnect within 5–15 seconds are excluded from both numerator and denominator. These are likely misdials or hang-ups before the IVR loaded; counting them inflates abandonment without reflecting real queue-driven dissatisfaction.
Typical benchmarks: Most contact center environments target an abandonment rate of 2–5%. Healthcare, financial services, and other urgent-contact environments typically target below 2%. Rates above 8–10% indicate a material service level problem that warrants immediate investigation.
What Actually Drives High Abandonment
Before implementing any intervention, diagnose the actual cause. The same abandonment rate can have six different root causes, and the right fix depends entirely on which one is in play.
1. Understaffing relative to call volume
The most common and most direct cause. When there are not enough agents available to handle the volume of calls entering the queue, queue depth grows, wait times climb, and callers abandon. No amount of callback configuration, hold music improvement, or IVR redesign resolves genuine understaffing. The fix is getting more agents on the phones — either by adding headcount, adjusting schedules, or pulling in agents from non-phone tasks during volume peaks. Everything else is a management tool for the edges of a well-staffed operation.
2. Inaccurate volume forecasting
You may be staffed correctly for the volume you planned, but if actual volume exceeds the forecast — because of a product issue, a billing cycle, a marketing campaign, or seasonal demand — the schedule will fall short. Accurate call center forecasting is the upstream prerequisite to correct staffing. If your forecast error is consistently in one direction, the methodology needs adjustment: historical decomposition, event calendars, and same-day volume trending all improve forecast accuracy. Same-day intraday adjustments are the operational safety valve when the forecast misses.
3. Poor schedule adherence
Agents may be scheduled correctly, but if they are late to their desks, taking breaks at the wrong time, or in training during peak hours, effective capacity falls below planned capacity. Schedule adherence is a direct multiplier on the value of your schedule: a team with a 90% schedule adherence rate delivers 10% fewer agent-hours than planned — which can be the difference between a manageable queue and a collapsing one. Every 1% of adherence lost reduces effective capacity proportionally. Adherence tracking and feedback are not micromanagement; they are basic queue health management.
4. Average handle time creep
Average handle time (AHT) is the total time an agent spends on a call including any after-call work. When AHT increases — because of system slowness, agent skill gaps, policy complexity, or growing wrap-up time — agents are occupied longer per call. Even with the same headcount, queue depth grows because each agent is processing fewer calls per hour. Identify AHT drivers before pulling staffing levers: if AHT has increased by 30 seconds per call across 20 agents, that is equivalent to losing roughly 5–6 agents in effective capacity. Addressing the AHT driver may be more efficient than hiring.
5. Concentrated volume spikes
Monday morning opens, post-outage contact floods, end-of-month billing cycles, and post-marketing-send peaks all create demand concentrations that are expensive to staff for permanently. A queue that averages 50 calls per hour but sees 200 calls per hour for one hour on Monday mornings cannot be staffed at 200-call capacity all week without enormous waste. Options include demand shaping (communications that redistribute contact timing), overflow routing to alternate destinations, or a scheduled flex agent pool that can be mobilized on short notice for known recurring peaks.
6. Wrong queue design
Callers entering the wrong queue — because of IVR misrouting, unclear menu options, or a queue that no longer matches how callers describe their needs — experience lower first-contact resolution probability and longer handle times, both of which compound queue depth. A caller in the wrong queue also has a lower tolerance for waiting, because they already know they may need to transfer. Regular review of queue-entry accuracy (are callers in the queue they should be in?) is part of abandonment diagnosis.
How to Reduce Abandonment: Proven Interventions
Each of the following interventions genuinely reduces abandonment — but each comes with specific implementation requirements and honest caveats worth understanding before deployment.
1. Queue callback (virtual hold)
Queue callback offers callers the option to hang up and receive a return call when an agent becomes available, without losing their place in line. For callers who would otherwise abandon after a long wait, this converts a frustrated abandon into a managed callback. The reduction in hold abandonment can be substantial — callers no longer need to stay on the phone to preserve their queue position.
The caveat is that callback success depends on execution. A callback offer only helps if the callback actually connects. Failed first-attempt callbacks should retry at least once, ideally twice, before treating the contact as unresolvable. Callback connect rates vary significantly by the time of day the callback is made, the number being called back (mobile vs. landline, call-screening behavior), and whether the returned call is recognizable to the recipient. Measuring callback connect rate separately from callback offer rate is necessary to understand whether the feature is actually serving its purpose.
2. Estimated wait time announcements
Telling callers how long they can expect to wait before reaching an agent measurably increases patience. The mechanism is straightforward: uncertainty about wait duration is more stressful than a known, bounded wait. A caller who knows they will wait eight minutes is more likely to stay than one who does not know if the wait will be two minutes or twenty.
Accuracy is critical. An overestimate of wait time is preferable to an underestimate. A caller told to expect eight minutes who reaches an agent in six minutes has a pleasant surprise. A caller told to expect two minutes who waits ten minutes experiences a compounding frustration that typically ends in abandonment and a damaged perception of the organization. Inaccurate estimated wait time announcements can increase abandonment even when the actual wait is reasonable. If your platform's EWT calculation is known to be inaccurate, it is often better to offer a range or simply not announce an EWT.
3. Queue overflow to alternate destinations
When queue depth exceeds a defined threshold — by wait time, by number of callers waiting, or by time of day — overflow routing can redirect callers to a voicemail capture, a different team capable of handling the contact type, a digital channel option, or a callback enrollment flow. Overflow removes callers from the abandoned pool by giving them another resolution path before they give up on their own.
The design of the overflow destination matters. A queue timeout that sends callers to a voicemail box that is never checked creates the illusion of a safety net while delivering a poor experience. Overflow routing should route to a place where the contact will actually be resolved — even if that resolution is delayed. See also: call queue overflow for configuration patterns.
4. IVR self-service deflection
Contacts that can be resolved through automated self-service — account balance checks, order status, appointment confirmation, password resets, basic FAQs — should never enter the live queue at all. Every contact that self-service resolves is a contact that does not contribute to queue depth, queue wait, or abandonment. IVR self-service has the highest return on investment of any abandonment reduction intervention because it removes contacts from the queue entirely rather than just managing them better once they are in it.
The caveat is that self-service only helps if it works accurately and resolves what callers actually need. An IVR self-service menu that fails to resolve contacts correctly and routes frustrated callers into the queue — now angrier than when they called — is worse than no self-service option. Containment rate (the percentage of callers who successfully resolve via self-service without requesting an agent) is the correct metric for evaluating this lever.
5. Intraday staffing adjustments
Real-time dashboards showing rising queue depth, increasing average speed of answer, or service level trending below target are the signal for intraday supervisory intervention. Actions available in real time include pulling agents from non-call tasks like after-call work wrap-up coaching or administrative duties, shortening or staggering breaks, calling in agents from a flex pool, or briefly suspending outbound activity to redirect capacity. The window for effective intraday intervention is narrow — queue problems compound quickly — so real-time alerting and clear escalation protocols matter more than the specific interventions available.
6. Appointment scheduling and callback booking
For non-urgent contacts, offering callers a scheduled callback slot — rather than placing them in the live queue — removes them from the immediate queue while preserving their intent to resolve the issue. Scheduled callbacks allow agents to prepare for specific contact types and allow staffing to be planned around the callback schedule. This intervention is most effective for contact types where the caller has a choice about timing and the matter is not urgent. It is less effective for contacts that need immediate resolution and works poorly if the callback appointment system is difficult to use via IVR.
False Improvements That Distort Reporting Without Helping Callers
Abandonment rate is visible to management, and that visibility creates incentive to improve the number rather than the underlying customer experience. The following are common reporting adjustments that make abandonment rate look better without actually reducing caller frustration.
1. Extending the short-abandon exclusion window
The short-abandon exclusion exists to remove accidental disconnects from the abandonment count — calls that ended before the caller could have been meaningfully affected by the queue. The standard window is 5–15 seconds. Expanding that exclusion window to, say, 45 or 60 seconds removes a much larger portion of abandoned calls from the reported rate because a significant fraction of callers who abandon do so within the first minute of waiting. The reported abandonment rate falls; the number of callers who gave up on reaching you does not.
2. Changing the denominator
Abandonment rate calculated as (abandoned calls / answered calls) produces a lower number than the correct formula (abandoned calls / total offered calls), because the denominator is smaller. Switching to the answered-calls denominator mid-reporting period — or reporting both formulas without clearly distinguishing them — creates an apparent improvement in abandonment rate with no corresponding improvement in caller experience. Any comparison across periods must use the same denominator definition consistently.
3. Reducing IVR length to push callers into queue faster
Shortening IVR menus to get callers into the agent queue faster seems like it would help callers — less time navigating menus. But the IVR is also where self-service happens. A shorter IVR that routes more callers into the live queue before they have been offered self-service increases total queue volume, increases wait times, and can raise abandonment even as the reported IVR duration falls. IVR length should be optimized for containment rate and routing accuracy, not minimized as an end in itself.
4. Pressuring agents to reduce AHT
Reducing AHT does increase the number of calls an agent can handle per hour, which reduces queue depth and can reduce abandonment. The problem is how the AHT reduction is achieved. Agents pressured to rush through calls without fully resolving them produce shorter calls but lower first-contact resolution rates. Callers who did not get resolved call back, increasing total contact volume. The queue shrinks temporarily; total demand grows. This can result in an operation that appears to be answering calls faster while the total number of calls — and total queue pressure — continues to increase. AHT reduction should come from process improvement, better tools, and targeted coaching — not from rushing agents through unresolved contacts.
The Callback Measurement Complication
When you implement queue callback, your abandonment rate may initially appear to increase. This is not a sign that callback is failing — it is a measurement artifact worth understanding before presenting the data to management.
The mechanism: a caller who accepts the callback offer hangs up and waits for the return call. In many platform configurations, this hang-up is recorded as an abandoned call because the caller disconnected before reaching an agent. The caller's experience is the opposite of abandonment — they chose a resolution path and are actively waiting for a callback — but the call record reads the same as a frustrated hang-up.
The result is that callback implementations can cause reported abandonment to rise at the same time that frustrated abandonment (the kind that damages customer satisfaction) falls. Hold time drops; callback-enrolled disconnects rise; the net change in reported abandonment may be positive even though the operation is serving callers better.
Correct measurement requires one of two adjustments. The preferred approach is to subtract successful callback opt-ins from the abandoned call count — a caller who enrolled in callback is not an abandonment. The alternative is to track "frustrated abandonment" as a separate metric: callers who disconnected without enrolling in callback and without being offered any alternative. Some platforms provide this distinction natively; others require custom reporting logic. Whichever approach you use, document it explicitly so that any apparent rise in reported abandonment at callback launch does not trigger the wrong corrective response.
When Abandonment Rate Is Acceptable to Increase
Not every increase in abandonment rate represents a service failure. There are specific scenarios where a deliberate increase in reported abandonment is the correct outcome of a good operational decision.
Aggressive self-service implementation: If you introduce an IVR or web self-service flow that resolves 20% of contacts that previously entered the live queue, your remaining queue contacts will be a more complex, longer-handle-time mix. If the self-service flow offers callers an "or press 0 to speak with an agent" escape and some fraction of callers press 0 and then abandon, the abandonment rate on the live queue may increase even though total caller volume is lower and more contacts are being resolved. The correct evaluation metric is cost per resolved contact and overall resolution rate — not abandonment rate in isolation.
Routing callers to better-fit channels: Implementing a digital deflection offer — "for faster service, visit our website or start a chat" — presented at the start of the IVR will cause some callers to hang up and pursue the digital channel instead. These hang-ups may register as abandons. If the digital channel successfully resolves their need, the caller experience was positive even though the phone abandonment count increased.
Deliberately thin staffing of low-value queues: Some contact centers consciously accept higher abandonment on lower-priority queues as a resource allocation decision — protecting service level on high-value or high-urgency contacts by concentrating agent capacity there. This is a legitimate trade-off as long as it is intentional, documented, and the callers in the deprioritized queue have access to an alternative resolution path rather than simply being left with no option.
In all these cases, abandonment rate should be tracked alongside resolution rate and customer satisfaction, not treated as the sole measure of queue health. A rising abandonment rate that accompanies rising self-service resolution and stable CSAT is a different problem than a rising abandonment rate that accompanies rising repeat contact volume and falling CSAT.
Frequently Asked Questions
Use our free On-Hold Cost Calculator to quantify the cost of hold time and abandonment on revenue — no email required.
Abandonment rate is one of the clearest signals in contact center operations — when it rises, queue wait times are too long for your caller population. Fixing it means addressing the root causes upstream: staffing, forecasting, schedule adherence, and queue design. For the upstream input to all of this, see call center forecasting and scheduling. For the mechanics of what happens when queue depth exceeds capacity, see call queue overflow and call queue timeout.