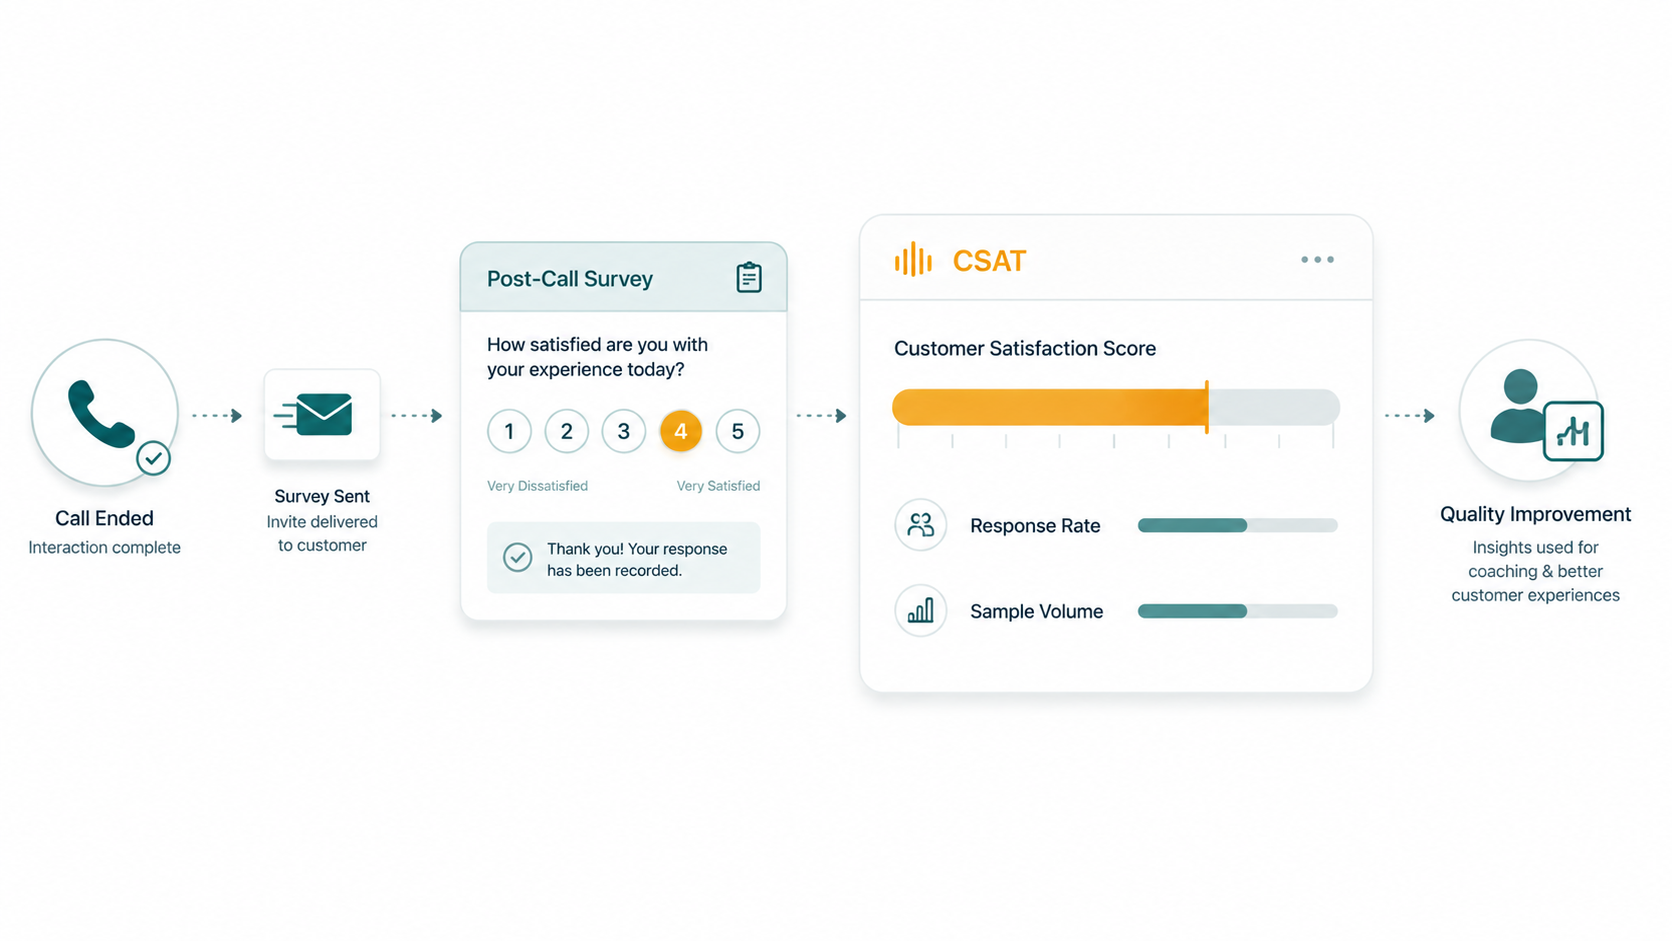
CSAT (Customer Satisfaction Score) measures how satisfied a customer was with a specific interaction — typically a single call, chat, or service request — using a short post-interaction survey. The result is expressed as a percentage of respondents who indicate they were satisfied, calculated from a simple rating question. It is a transactional metric: it tells you how a specific interaction landed, not how the customer feels about the organization overall.
CSAT is one of the most widely used metrics in contact center operations because it connects directly to what contact centers exist to do: give customers a good experience when they need help. Understanding how to collect it, calculate it, and interpret it honestly — including its meaningful limitations — makes the difference between a CSAT program that drives improvement and one that generates numbers with no operational value.
The standard CSAT survey
The core CSAT survey question is typically a variation of: "How satisfied were you with your interaction today?" or "How satisfied were you with the service you received?"
The question is usually rated on one of two common scales:
- 1–5 scale: 1 = Very Dissatisfied, 3 = Neutral, 5 = Very Satisfied
- 1–10 scale: 1 = Extremely Dissatisfied, 10 = Extremely Satisfied
The survey is delivered immediately following the interaction — typically via IVR prompt at the end of a call ("Please stay on the line to rate your experience"), SMS message sent to the customer's number after the call ends, or email sent within hours of the interaction.
IVR surveys have the advantage of capturing responses while the interaction is still fresh. SMS and email surveys allow customers to respond in their own time and may support more questions, but response rates are generally lower and the memory of the interaction has faded further.
How CSAT is calculated
CSAT formula: CSAT % = (Number of satisfied responses ÷ Total valid responses) × 100
The definition of "satisfied" varies by organization and scale. On a 5-point scale, some organizations count only respondents who rated 5 (Very Satisfied) as satisfied. Others count 4s and 5s together. On a 10-point scale, satisfied might mean 7 and above, or 9 and above. There is no universal standard — which means CSAT scores from different organizations using different definitions are not directly comparable, even if the question wording is similar.
This is important to understand when looking at industry benchmark data: if one organization counts 4s and 5s as satisfied while another counts only 5s, their reported CSAT scores will differ substantially even if underlying customer satisfaction is identical.
The response rate problem
Post-call survey response rates are typically low — a small fraction of customers who complete an interaction actually respond to a satisfaction survey. The exact rate varies considerably by channel, industry, survey timing, and customer base. Whatever the actual number in your context, the result is a sample, not a census.
This has a specific implication: your CSAT score reflects the satisfaction of customers who responded to the survey, not the satisfaction of all customers who had interactions in that period. If those two groups differ in their satisfaction levels — which they often do — your CSAT score will not perfectly represent overall customer satisfaction.
Response bias: Customers who had very positive experiences and customers who had very negative experiences both have stronger motivation to respond to a feedback survey than customers who had a moderate experience. This means CSAT scores can be skewed toward the extremes of the population rather than reflecting the middle. Very high CSAT scores can partly reflect this effect — the satisfied customers who responded were genuinely satisfied, but the many customers who were moderately satisfied or mildly dissatisfied may not have responded at all.
Recency bias: What the customer remembers most clearly at survey time is the most recent moment of the interaction — typically the resolution or non-resolution at the end. A call that was handled well throughout but ended with an unresolved issue will likely produce a negative score even if the agent performed well on every other dimension. Conversely, a difficult call that ended with a satisfying resolution may produce a positive score that does not reflect the frustration earlier in the call.
What CSAT tells you and what it doesn't
CSAT is best understood as a transactional indicator: it captures how customers felt about a specific interaction at a specific moment. It is useful for:
- Identifying interactions that landed poorly and understanding why
- Tracking changes in satisfaction over time — did satisfaction improve after a training program, a policy change, or a routing redesign?
- Comparing satisfaction levels across queues, teams, or channels
- Flagging individual agents or call types with consistently low scores for QA review
CSAT is less reliable for:
- Predicting individual customer behavior — a low CSAT on a single interaction does not reliably predict churn
- Benchmarking against other organizations whose survey definitions differ
- Representing the full customer base when response rates are very low
Interpreting CSAT scores honestly
CSAT thresholds — "80% is good," "90% is excellent" — are frequently cited in contact center discussions, but there is no universal standard that applies across industries, organizations, scales, or survey methodologies. A CSAT score is meaningful primarily in context: compared to your own historical performance, compared across segments of your own operation, and compared to industry benchmarks that use the same survey methodology.
An organization that achieves a 75% CSAT in a complex technical support environment with long-tail resolution issues is not necessarily performing worse than one that achieves 90% in a simple transactional service context. The nature of the contacts, the customer population, and the definition of "satisfied" all shape what the number means.
The most actionable use of CSAT is not hitting a number — it is tracking direction and using score patterns to identify what is driving satisfaction and dissatisfaction. A CSAT score declining consistently over four weeks, or one queue consistently underperforming others, is the signal that matters. The absolute level is less diagnostic on its own.
CSAT vs. NPS vs. CES
CSAT is one of three widely used customer feedback metrics. Each measures something different.
| Metric | What it measures | Question focus | Best for |
|---|---|---|---|
| CSAT | Satisfaction with a specific interaction | "How satisfied were you with today's interaction?" | Post-interaction contact center QA and trending |
| NPS | Likelihood to recommend the organization | "How likely are you to recommend us to a friend?" | Relationship-level loyalty, brand health |
| CES | Ease of getting help or resolution | "How easy was it to get your issue resolved?" | Friction reduction, channel and process optimization |
NPS measures relationship-level loyalty — how a customer feels about the organization as a whole, not just how they felt about a single support call. It is less responsive to individual interaction quality and more appropriate for periodic relationship surveys than post-contact transactional measurement.
CES focuses on effort — how hard was it for the customer to get what they needed? Research has found that reducing customer effort correlates strongly with reducing dissatisfaction and churn. CES is particularly useful in contexts where the barrier to resolution is the main driver of frustration, rather than agent quality or product issues.
Many organizations track all three, using them for different purposes. CSAT belongs at the individual interaction level; NPS at the periodic relationship level; CES at the process and channel level. For a broader look at how these metrics fit into an overall customer experience strategy, including how contact center operations connect to long-term loyalty, see the customer experience guide.
EaseDial Analytics
CSAT, call volume, AHT, queue performance — all in one reporting view.
Connecting CSAT to contact center operations
CSAT scores are most useful when they can be connected to specific operational variables. If CSAT scores drop, what changed? Look for correlations with:
- Wait time increases — customers who waited longer tend to rate interactions lower even when the agent performs well
- Changes in queue routing — a new routing rule may have sent calls to agents who were not the best match for the contact type
- Product or service issues — a spike in contacts about a specific problem often drives CSAT down independent of agent performance
- Agent cohort differences — a group of newly trained agents may score differently from experienced ones on the same queue
- Channel differences — phone calls, chats, and email interactions often produce different CSAT distributions even for the same underlying issue
Pairing CSAT with qualitative data — call recordings, transcripts, sentiment analysis — helps explain the score rather than just reporting it. For more on sentiment analysis as a complement to CSAT, see What Is Call Sentiment Analysis?. For a practical guide to collecting post-call CSAT in EaseDial and using it for agent coaching, see EaseDial customer feedback and CSAT tools.
CSAT in the QA and coaching cycle
CSAT scores produce their highest operational value when they feed directly into the quality assurance and coaching cycle — not when they sit in a dashboard as a number to report. The practical loop looks like this: low-CSAT interactions get flagged for QA review, a scorecard evaluation identifies which behaviors drove the outcome, and coaching targets the specific gap rather than agent performance generally.
First-call resolution (FCR) is the single metric most consistently correlated with CSAT in contact center research. When customers get their issue resolved on the first contact without a callback or transfer, satisfaction tends to be high regardless of handle time. When FCR is low — customers transferring multiple times, calling back about the same issue — CSAT tends to fall even when individual agent interactions were handled warmly. This means diagnosing a CSAT problem often means first asking whether FCR is sound, and FCR problems usually point to routing logic, knowledge base gaps, or authorization constraints rather than agent behavior. See the Call Center Metrics and KPIs guide for how FCR and CSAT interact in the broader KPI stack.
Speech analytics changes the practical ceiling of CSAT-driven coaching by extending coverage well beyond what manual review can sustain. Manual QA programs typically review a small subset of interactions — the exact share depends on team size, handle time, and tooling — which means coaching targets surface slowly and inconsistently. When speech analytics is applied to recorded calls, it can score a substantially larger share of interactions against the same criteria — script adherence, resolution language, escalation markers, empathy signals — depending on recording coverage and processing configuration. The coaching queue becomes prioritized automatically: agents with the most low-CSAT, low-scoring interactions surface without a supervisor having to manually identify them. The CSAT score validates the automated scoring; the automated scoring explains what drove it. For how this integrates with structured QA evaluation, see building and calibrating a call center QA scorecard.
Frequently Asked Questions
For the broader measurement context, see Contact Center Analytics and the complete Call Center Metrics and KPIs guide. For the supervisor monitoring that connects to call quality and CSAT, see Listen, Whisper, Barge, and Intercept.