When a customer calls your contact center and hears "all agents are currently busy," a clock starts. After about two minutes, 66% of callers have reached the limit of their patience. After four minutes, many are gone for good — and 85% of those abandoned calls will never call back. That's not a customer service problem. It's a revenue problem.
The tension at the center of every contact center is simple: call arrivals are random, but agent capacity is fixed. You cannot perfectly predict when 50 calls will arrive in the same 5-minute window. What you can do is build systems — mathematical, operational, and technological — that absorb that unpredictability without letting customers bear the cost of it.
This guide covers the full scope of call queue management: how queues work, the staffing math behind wait time calculations, the strategies that reduce actual and perceived hold time, and the metrics that tell you whether any of it is working.
What Is Call Queue Management?
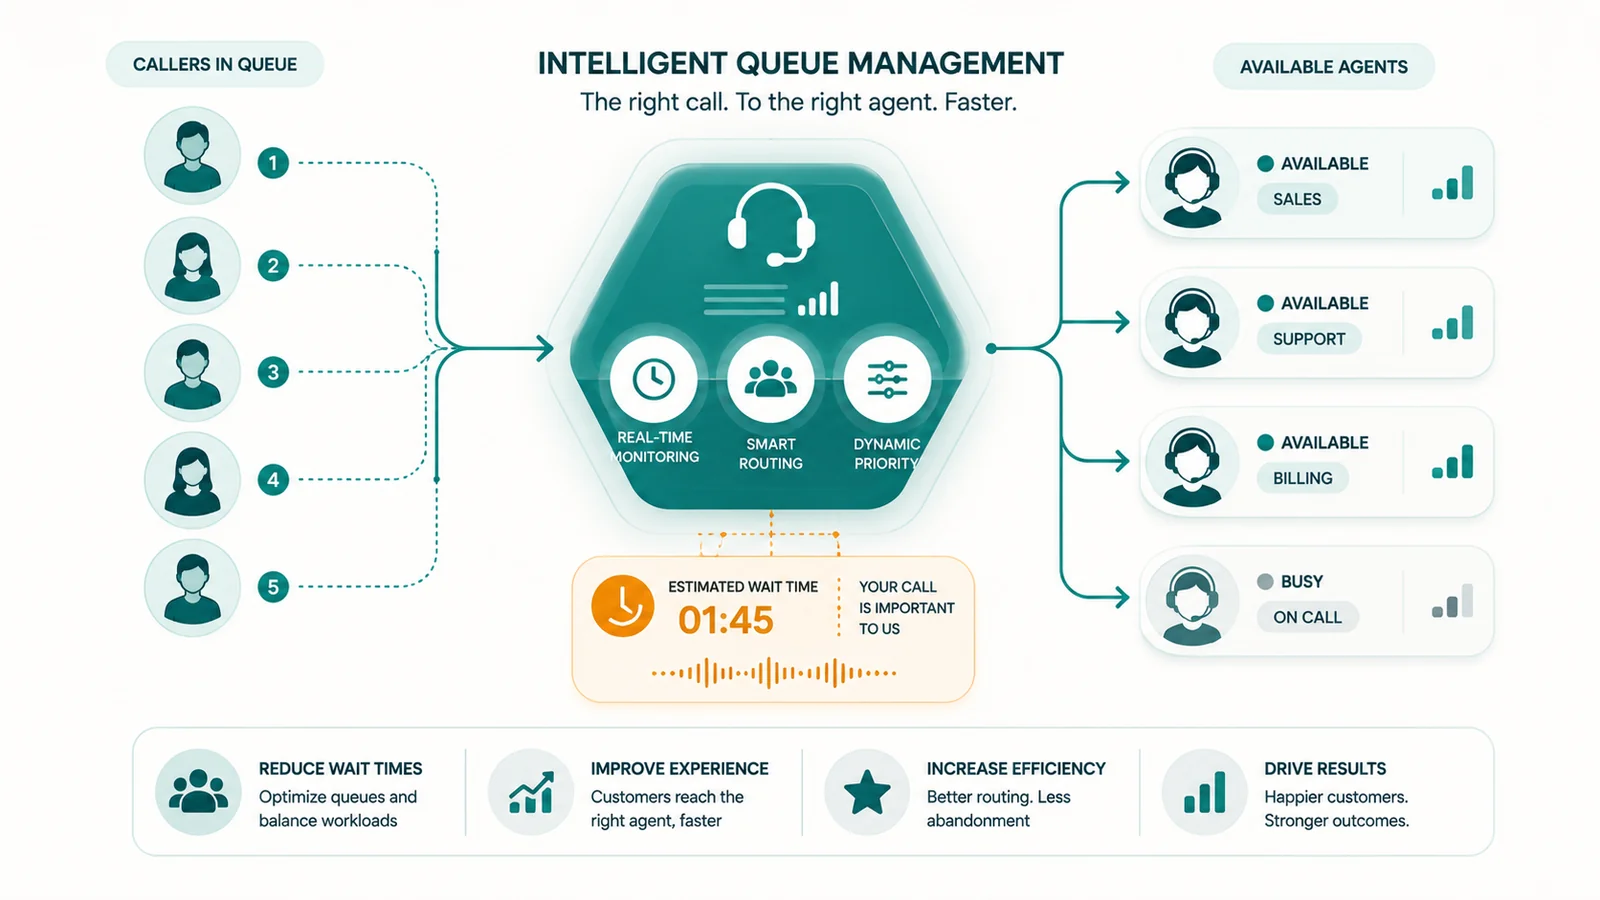
Call queue management is the set of processes and technologies a contact center uses to organize, prioritize, and route inbound calls that cannot be immediately answered — with the goal of minimizing customer wait times, reducing abandoned calls, and meeting service level targets. It includes staffing models, real-time routing rules, virtual queuing and callback systems, estimated wait time announcements, priority management, and queue analytics.
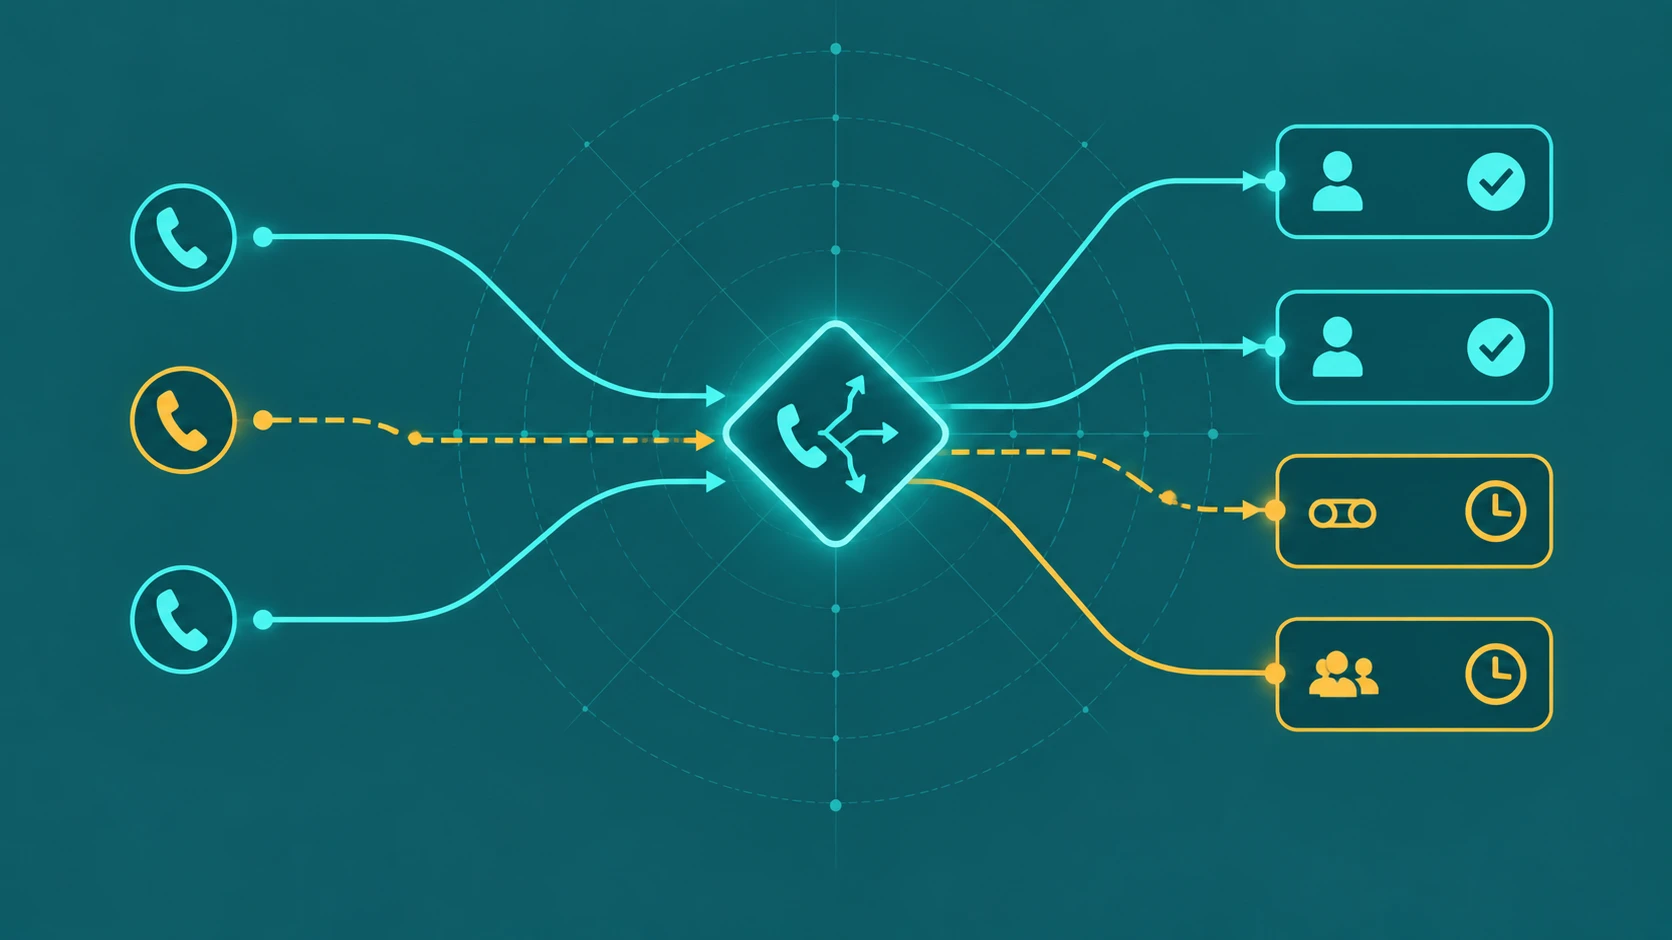
When all agents are occupied, an Automatic Call Distributor (ACD) places the incoming call into a queue. That queue has rules: who gets served first, how long callers wait before being offered an alternative, when overflow to voicemail or a backup team triggers, and what callers hear while they wait. Managing those rules — and having the right number of agents available in the first place — is what call queue management means in practice.
Key terms you'll see throughout this guide
- ACD (Automatic Call Distributor): The core telephony engine that routes calls to agents and manages queue ordering.
- ASA (Average Speed of Answer): The mean time from when a call enters the queue to when an agent picks up.
- AHT (Average Handle Time): Talk time plus hold time plus after-call work. The primary driver of how deep a queue becomes.
- Service Level (SL): The percentage of calls answered within a target time window — e.g., 80% within 20 seconds.
- Occupancy Rate: The percentage of time agents spend handling calls rather than waiting for the next one. See our guide to contact center agent occupancy for detail on healthy targets and the non-linear relationship with wait time.
- Shrinkage: The portion of scheduled time when agents are unavailable (training, breaks, absences). Typically 25–35%. See our guide to call center shrinkage for how to calculate and manage it.
- FCR (First Contact Resolution): The percentage of contacts resolved without a follow-up — the strongest single driver of customer satisfaction.
- Virtual Queue / Callback: A system that holds a caller's queue position without requiring them to stay on the line.
- EWT (Estimated Wait Time): A real-time calculation of how long a caller should expect to wait before reaching an agent.
Types of Call Queue Management Systems
The term "call queue management system" covers a range of technologies — from a module inside a legacy PBX to a fully cloud-native contact center platform. Understanding the landscape helps you evaluate whether your current system is limiting performance, and what alternatives look like.
Cloud-based CCaaS platforms
Cloud Contact Center as a Service (CCaaS) platforms provide queue management as part of a broader hosted contact center suite. Call routing, ACD logic, IVR, workforce management, analytics, and agent tools all operate from the same cloud infrastructure — no on-premise hardware required. CCaaS platforms scale elastically, which matters for handling volume spikes without pre-provisioning excess capacity. Most enterprise-grade queue management deployments today run on a CCaaS platform. For smaller teams starting out with cloud-based phone systems, queue management is often bundled as part of a business phone system rather than a standalone contact center product.
On-premise PBX queue modules
Traditional on-premise PBX systems include queue management as a licensed module — typically an ACD function built on top of the core switching hardware. These systems require physical infrastructure, per-channel licensing, and in-house IT administration. Queue capacity is constrained by the hardware's line count rather than cloud elasticity. On-premise systems are still found in large enterprises with existing hardware investments or regulatory requirements around data residency, but new deployments have largely shifted to cloud.
Standalone ACD and routing platforms
Some organizations use a dedicated ACD platform that sits in front of an existing phone system, handling routing and queue logic independently of the underlying PBX. This approach allows organizations to modernize queue management without replacing legacy infrastructure, though it adds integration complexity.
Call Queue Management for Small Businesses
The Erlang C math, skills-based routing, and WFM tooling described in this guide are designed for contact centers with dozens to hundreds of agents. Small businesses — those with 1–15 people handling inbound calls — have the same underlying queue problem (more calls than available agents at peak times) but a different operational reality.
For small teams, the practical priorities are:
- Simple queue with estimated wait time. Even a two- or three-person team benefits from a queue that tells callers how long to expect, rather than ringing indefinitely or going straight to voicemail. Most cloud business phone systems include basic queue functionality.
- Callback option. A callback or virtual queue feature is high-ROI at any team size. If callers regularly wait more than two minutes, a callback offer reduces abandonment and improves perception without requiring additional staff.
- IVR for self-service deflection. A simple IVR menu that handles the most common inquiry types (hours, address, basic FAQs) before reaching the queue reduces call volume without adding headcount. Even a one-level IVR has measurable impact on queue depth during peak periods.
- Overflow to voicemail or an AI agent. Configuring a clear overflow destination — so calls that exceed queue capacity don't disappear — is more important for small teams than sophisticated routing logic. A well-configured AI Voice Agent as overflow can handle routine contacts without a human.
- Monitoring the right two metrics. Small teams don't need a full analytics suite. Track abandonment rate (how many callers hang up before being answered) and missed calls (calls that left no voicemail and received no callback). Those two numbers surface queue problems faster than any other metric at this scale.
The Science Behind Queues: Erlang C and Why Occupancy Is Non-Linear
Danish mathematician Agner Krarup Erlang developed the queueing model now known as Erlang C in 1917, originally to solve telephone exchange capacity problems. Over a century later, it remains the foundation of contact center staffing worldwide.
The formula answers a specific question: given a known call arrival rate and average handling time, how many agents do you need to achieve a target service level? It does this by calculating the probability that any given call will have to wait — and how long.
The inputs Erlang C needs
- Call arrival rate (λ): How many calls arrive per time period (e.g., 100 calls per hour)
- Average Handle Time (AHT): How long each call takes on average (e.g., 3 minutes)
- Number of agents (N): The variable you're solving for
- Target service level: Your goal (e.g., 80% answered within 20 seconds)
- Shrinkage: The adjustment for agent unavailability
A worked example
Suppose your contact center receives 100 calls in 30 minutes, with an average handle time of 3 minutes and a target of 80% answered within 20 seconds. Traffic intensity (the number of Erlangs) is 100 calls × 3 minutes = 300 call-minutes, or 5 Erlangs per 30-minute interval. Erlang C calculates that you need 14 agents to achieve that service level. Factor in 30% shrinkage (breaks, training, absences), and your scheduled headcount rises to 20. At 20 agents, you'd actually achieve 88.8% answered within 20 seconds, with an average speed of answer of about 8 seconds.
The calculation changes meaningfully every 30 minutes as call volume shifts. This is why workforce management software runs Erlang calculations for each half-hour interval across the day — not once for the whole shift.
Erlang C vs. Erlang A: which one should you use?
Erlang C assumes callers wait indefinitely. In the real world, they don't. Erlang A (also called the Palm model or M/M/c+M) extends the formula by modeling caller impatience — it adds a patience-time parameter that represents how long the average caller will hold before abandoning.
For any contact center with an abandonment rate above 3%, Erlang A produces more accurate staffing recommendations. Erlang C over-staffs by allocating agent capacity to callers who would have abandoned anyway. The practical difference: on a 200-seat center running 8% abandonment, Erlang C might recommend 15 more agents than Erlang A for the same service level target — a meaningful cost difference. Most modern workforce management platforms offer both formulas; Erlang A is now the professional default for voice queues.
The most important concept in queue management: occupancy is non-linear
If you take one thing from the math, make it this. The relationship between agent occupancy and customer wait time is exponential, not linear.
Moving an agent team from 80% to 90% occupancy does not increase wait time by 12.5%. It can triple it. This is because Erlang's formula involves factorials of agent counts — small reductions in available capacity at high occupancy produce dramatic wait time increases. At 95% occupancy, wait times become effectively unpredictable and unmanageable.
The practical implication: targeting 90%+ agent occupancy to minimize idle time is a false economy. The wait time and abandonment costs of that last 10% of capacity far outweigh the cost of an agent sitting idle for a few minutes per hour. The healthy occupancy target for voice queues is 75–85%.
How a Call Queue Works: Step by Step
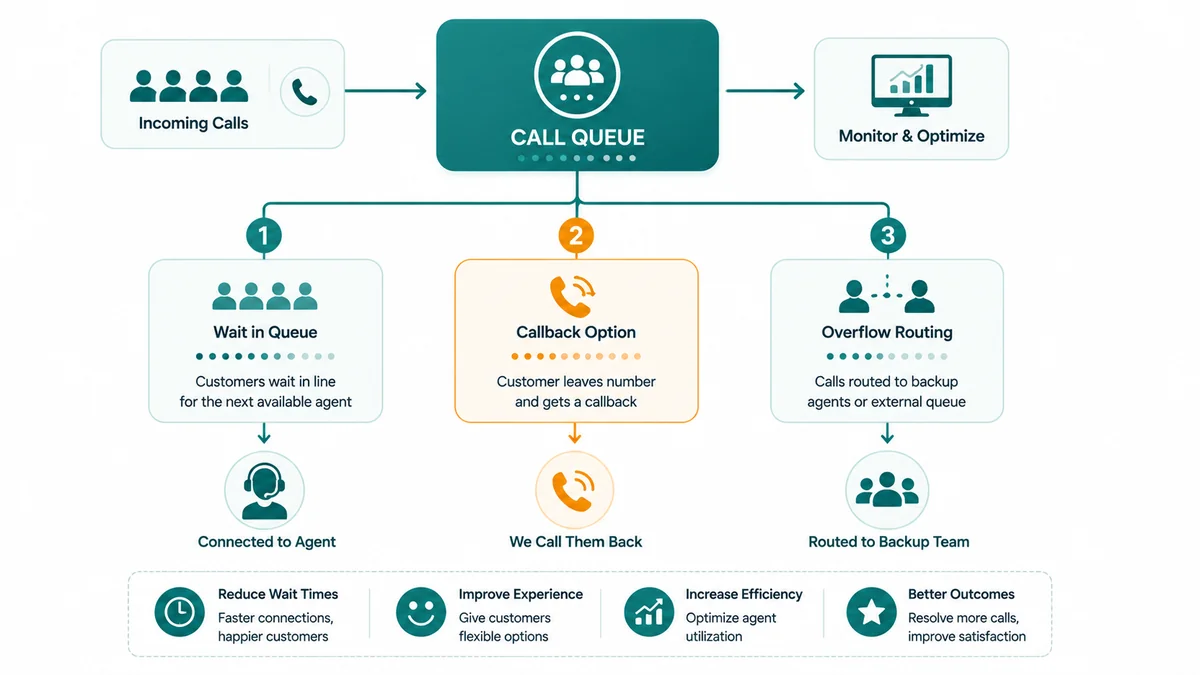
Here's the full lifecycle of a call entering a managed queue:
- Call arrives at the ACD.
- IVR performs initial triage — self-service attempt, intent capture, language selection, caller ID lookup.
- Agent availability check. If an agent is free, the call connects immediately. If not, it enters the queue.
- Queue position and EWT announcement plays. The caller knows where they stand.
- Callback offer triggers if wait time exceeds a configured threshold (often 4–6 minutes). The caller can choose to hang up and receive a callback when they reach the front.
- If the callback is accepted, the caller's queue position is preserved without them staying on the line.
- If no callback or the threshold wasn't reached, hold music and periodic updates continue.
- When an agent becomes available, the ACD selects the next eligible call based on routing rules (FIFO, priority, skills match).
- The call connects. The agent receives a CRM screen-pop with the caller's history and context.
- After the interaction, the agent completes after-call wrap before returning to available state.
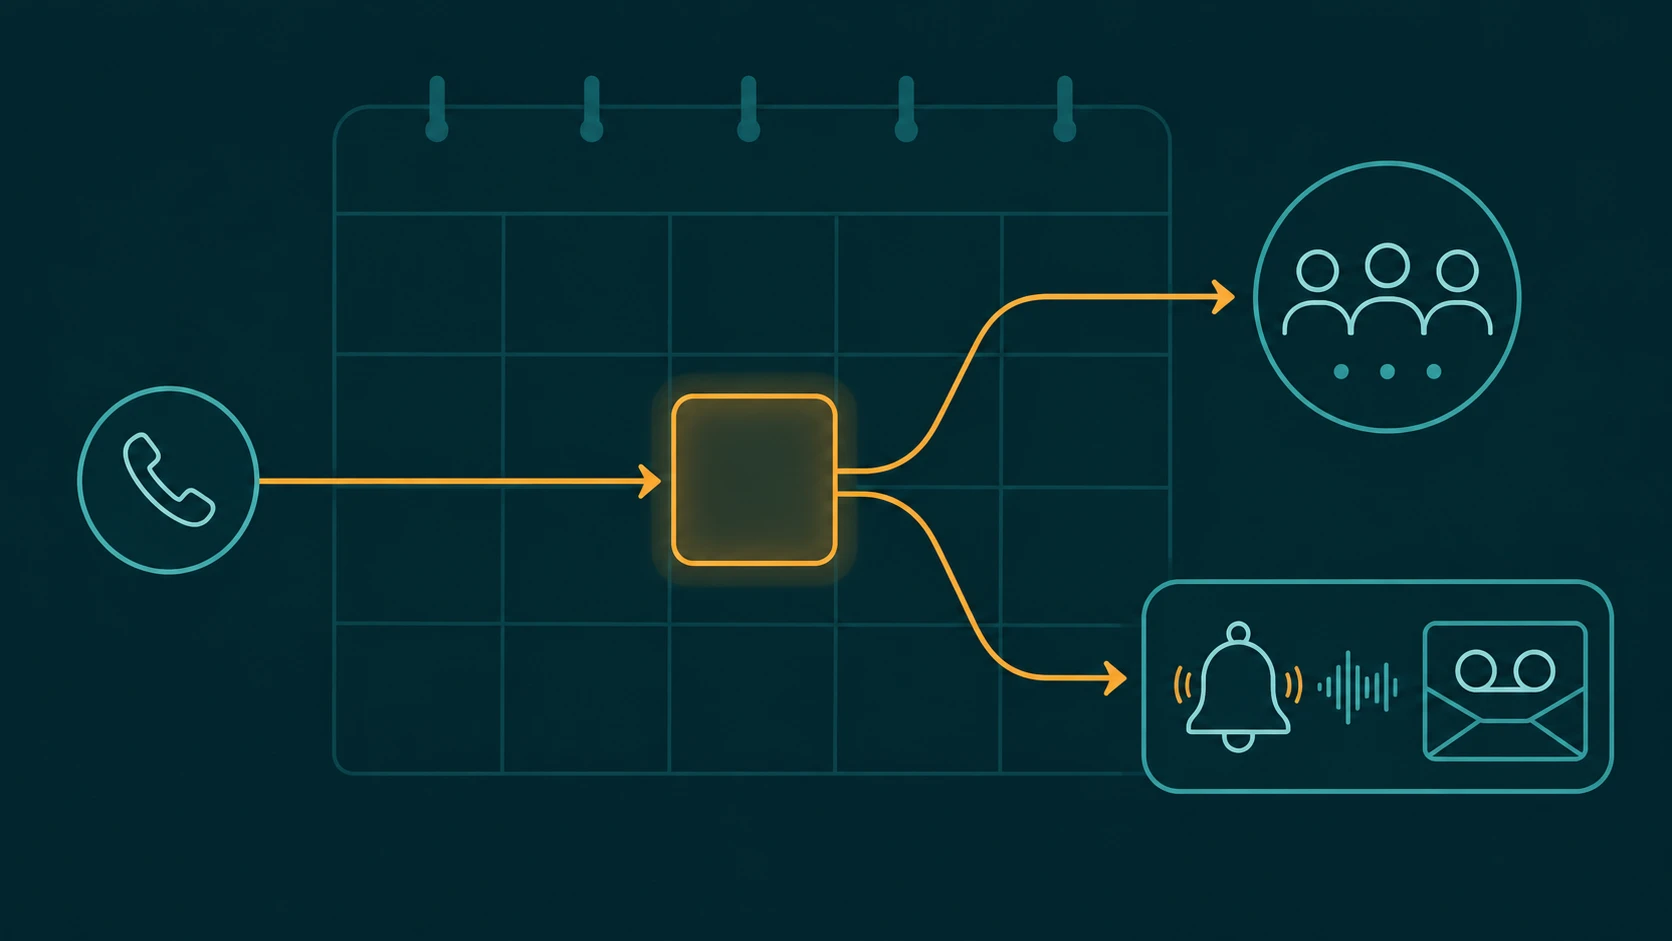
If queue depth exceeds a maximum threshold or wait time exceeds an SLA ceiling, an overflow rule fires: the call routes to voicemail, a secondary team, an external answering service, or an AI voice agent, and a supervisor alert triggers.
Diagnosing queue problems
"The queue is bad" is not a diagnosis. Different queue problems have different root causes and different fixes. The right place to start is identifying which problem you actually have.
Wait time is too high
High wait time is often a routing problem before it is a staffing problem. Pure first-in, first-out (FIFO) queuing works fine when all agents can handle all contact types. The moment you have billing specialists, technical support staff, and Spanish-speaking agents, FIFO breaks down — callers wait for agents who can't help them while the right agent sits idle.
Skills-based routing directs each call to an agent with the matching capability. This reduces transfers (each transfer adds 2–3 minutes to resolution time), improves first contact resolution, and ensures callers aren't waiting in a queue that's wrong for their inquiry type. According to industry research, 76% of CX leaders now use skills-based routing combined with AI-powered initial triage. You can learn more about how routing logic is structured in our guide to call routing.
Running all contact types through a single queue compounds the problem: complex, long-AHT contacts block simple ones. A 15-minute technical troubleshooting call backed up behind a 2-minute billing inquiry extends the wait for the billing caller unnecessarily. Segmenting into separate queues by contact type — billing, technical support, sales, VIP accounts — allows each segment to be staffed and managed independently. Occupancy, SLA targets, and overflow rules can be calibrated per segment rather than compromised across all of them.
Deflecting contacts before they enter the queue has a compounding effect on wait time. Between 40% and 60% of inbound calls involve routine, repeatable requests — account balance checks, order status updates, appointment confirmations, payment processing. These calls don't need a human agent. They need a well-designed IVR or, better, an Intelligent Virtual Agent (IVA) that can handle them completely through natural language. Deflecting 30% of routine contacts before they enter the queue means fewer calls competing for agents, lower occupancy, and shorter wait times for the complex contacts that do need a human. Modern IVAs achieve approximately 30% containment rates at deployment and improve over time. For a deeper look at when IVR is the right tool versus a full AI agent, see our comparison of AI voice agents vs. IVR, and our guide to IVR systems.
Callers hang up before reaching an agent
Virtual queuing preserves a caller's position in the queue without requiring them to stay on hold. When their turn comes, the system places an outbound call back to them. The caller gets the same service level they would have received by waiting — without the frustration of listening to hold music.
The business case is strong. 75% of consumers say they prefer a guaranteed callback over waiting on hold. Callback implementations reduce call abandonment by approximately 32%. For any contact center where wait times regularly exceed 3 minutes, virtual queuing is one of the highest-ROI investments available.
One implementation note: a failed callback attempt damages caller trust more than hold time. Your callback system needs solid number validation, retry logic, and outbound dialing compliance (TCPA in the US, PECR in the UK). Don't deploy it without testing the full failure-and-retry path.
Estimated wait time announcements address abandonment through a different mechanism. Telling callers how long they'll wait has a measurable effect on whether they stay on the line. The psychological dynamic of an invisible phone queue is the opposite of a physical one: in a physical queue, you start frustrated and get progressively more comfortable as you approach the front. On hold, you start comfortable and grow increasingly uncertain. A specific EWT resets that anxiety — it gives the caller a reason to stay.
But EWT announcements only help when they're accurate. Two methods exist: using the actual wait time of the most recently answered call as a proxy, or calculating EWT directly as (calls in queue × AHT) / available agents. When AHT varies significantly by agent, time of day, or contact type, EWT estimates become unreliable. An announcement of "3 minutes" when the actual wait is 8 minutes is actively harmful — callers who trust the 3-minute estimate and hit the 4-minute mark will abandon immediately, frustrated by what they experience as a broken promise.
The rule: suppress EWT announcements in low-volume environments or when AHT variability is high. In those cases, queue position announcements ("you are 4th in line") are more reliable than time estimates. Update position announcements every 2–3 minutes — more frequently than that creates anxiety rather than reassurance. For scripting, music selection, and interval messaging design, see the call queue announcements guide.
Agents are unevenly loaded
For queues where all agents handle the same call type, the choice of call distribution strategy matters separately from skills-based routing. Ring All vs Round Robin covers the two most common approaches — Ring All for speed-first teams, Round Robin for equal workload distribution — and how team size and call volume affect the decision.
Queue reaches capacity or timeout
Every queue needs a defined ceiling. Without one, callers can wait indefinitely while the queue depth grows — and every new caller entering a 45-minute queue is effectively being mistreated before a single agent error occurs.
Overflow rules specify what happens when queue depth or wait time exceeds a threshold: route to voicemail with a callback promise, transfer to a secondary team, forward to an external answering service, or hand off to an AI voice agent that can handle the immediate request. Overflow routing is your safety valve — it should be configured before you need it, not during a surge.
For outage-driven spikes, which can reach 300–600% of normal call volume within the first hour, manual overflow management is too slow. This is where automated threshold rules (and increasingly, AI-powered incident detection) earn their value. When the system detects 100 similar contacts arriving within 5 minutes, it can deploy a deflection message before the queue collapses. For practical overflow configuration strategies tailored to smaller teams, see how to handle call overflow for small businesses.
Priority callers are waiting in the wrong order
Not all callers should wait in the same order. Priority queuing allows your ACD to fast-track specific segments — enterprise customers, callers on hold longer than a threshold, contacts flagged as at-risk in your CRM — while standard callers wait in the normal sequence.
One caveat: if you use position announcements, callers need to understand their position may change. A caller told "you are 3rd" who then sees "you are 4th" after a VIP caller is inserted will feel cheated unless the messaging is framed carefully. Priority queuing should be configured with this psychology in mind. For a full explanation of priority levels, anti-starvation aging, and VIP assignment methods, see call queue priority: how priority queuing works.
Rule-based routing is reacting too slowly
Rule-based queue management is reactive: a supervisor sees the queue depth growing and manually adjusts staffing or routing. AI-powered queue management is predictive: the system identifies patterns before they become problems and acts without waiting for human intervention.
Current AI queue capabilities include:
- Predictive volume forecasting: ML models that predict call arrival patterns at 15/30-minute interval granularity — not just extrapolating historical averages but identifying leading indicators of volume spikes.
- Sentiment-based priority routing: Detecting caller frustration in real time and elevating their queue position before they abandon. This reduces escalation rates by approximately 45% compared to rule-based routing.
- Agent Copilot: Surfacing relevant knowledge articles and next-best-action suggestions during calls — reducing AHT by up to 33% and improving first contact resolution.
- Predictive callbacks: AI initiating proactive outbound contact during low-volume windows to resolve pending issues before they re-enter the queue as inbound calls.
Gartner projected in 2022 that conversational AI would reduce global contact center agent labor costs by $80 billion by 2026, with 1 in 10 interactions fully automated. The direction is clear. For a broader look at where AI fits in the contact center, see our guide to AI in contact centers.
EaseDial Call Queues
Virtual queuing, skills-based routing, and real-time queue dashboards — built for contact centers that can't afford long hold times.
Staffing and Workforce Management: The Upstream Solution
Every queue management strategy in the section above is a response to a queue that already exists. Workforce management (WFM) is the discipline that determines how many agents are available before the queue forms — which makes it the highest-leverage intervention in wait time reduction.
WFM works by forecasting call volume for each 30-minute interval across the day (and week, and season), applying Erlang C or A to calculate the raw agent count needed to hit service level targets, adjusting for shrinkage, and generating a schedule. When WFM forecasting is accurate, queues are manageable. When it's off by even a few agents per interval during peak periods, occupancy spikes into the non-linear zone and wait times deteriorate fast.
Common WFM mistakes that create queue problems:
- Running a single Erlang calculation for the whole day instead of per-interval — morning peaks and post-lunch lulls have completely different staffing needs.
- Using outdated shrinkage estimates — a 5-point error in shrinkage translates directly to 1–2 agent shortfalls per interval at peak.
- Using Erlang C in high-abandonment environments instead of Erlang A — chronic over-staffing at some times, under-staffing at others.
- Ignoring the feedback loop: high occupancy increases sick days and attrition, which increases shrinkage, which increases occupancy — a self-reinforcing forecasting error.
Our guide to call center workforce management covers forecasting, scheduling, and intraday management in depth.
Queue Metrics: What to Measure and Why
| Metric | What It Measures | Healthy Range | Watch Out For |
|---|---|---|---|
| ASA (Average Speed of Answer) | Mean time from queue entry to agent pickup | Under 28 seconds (industry average) | ASA excludes abandoned calls — high abandonment paired with low ASA is a false positive |
| Service Level | % of calls answered within a target time | 80% within 20 seconds (80/20 rule) | A center can pass service level while still having many callers wait far longer than the target |
| Abandonment Rate | % of queued callers who hang up before reaching an agent | 3–5% (top performers under 3%) | 6% industry average; above 10% signals systemic queue failure |
| AHT (Average Handle Time) | Total time per interaction including wrap | Varies by contact type; industry average ~6 min 10 sec | High AHT drives queue depth; reducing AHT by even 30 seconds per call has a compounding effect on wait time |
| Occupancy Rate | % of time agents spend on calls vs. available | 75–85% | Above 90% causes exponential wait time increases and agent burnout |
| FCR (First Contact Resolution) | % of contacts resolved without a follow-up call | 70–79% good; 80%+ world-class (achieved by ~5% of centers) | Low FCR generates repeat calls that add to queue volume the next day |
The measurement blind spot you need to know about
Average Speed of Answer only counts calls that were answered. Customers who waited 10 minutes and abandoned are completely invisible in the ASA calculation. A contact center reporting a 22-second ASA might simultaneously have hundreds of customers abandoning after 8 minutes — and the ASA metric will never reveal that.
This is why abandonment rate must always be read alongside ASA. A center with 22-second ASA and 12% abandonment is not performing well — it's performing well for the callers who got through quickly, while failing the callers who gave up. For a full treatment of queue analytics and KPI frameworks, see our guide to contact center analytics. For a practical diagnosis of what causes high abandonment and which interventions genuinely reduce it — without rushing agents — see how to reduce call abandonment rate.
Industry Benchmarks: ASA by Sector
The 80/20 rule — answering 80% of calls within 20 seconds — is the standard most often cited as the industry benchmark. But "industry average" covers an enormous range. Here's what actual sector performance looks like:
| Sector | Typical ASA | Notes |
|---|---|---|
| E-commerce / Retail | Under 20 seconds | Amazon-set expectations; Black Friday spikes require surge planning |
| Financial Services | Under 20 seconds (target); 3 min 48 sec (actual average) | Banking sector significantly underperforms its own targets; high stakes for wait time |
| Healthcare | Under 2 minutes | Abandonment directly impacts patient outcomes; HIPAA governs callback data |
| Technology / SaaS | Under 2 minutes | Complex contacts; tiered SLA queues by contract tier are standard |
| Telecommunications / ISP | Under 45 seconds | Outage-driven flash surges of 300–600% are the primary challenge |
| Utilities / Public Sector | 120+ seconds (UK average) | Among worst performers; constrained by legacy infrastructure and budget |
Source: ACXPA 2025 mystery shopping data (sector ASA); ContactBabel UK Contact Centre Decision Makers' Guide (utilities/public sector).
The takeaway: a 45-second wait is considered excellent in telecom and unacceptably long in e-commerce. Applying a single benchmark across all industries will lead to wrong conclusions. Measure your center against your sector, not the generic average.
Common Mistakes and How to Avoid Them
Measuring ASA without measuring abandonment
As covered above, ASA only measures calls that were answered. Tracking it without abandonment rate gives a systematically optimistic view of actual customer experience. Always pair them.
Setting EWT announcements in high-AHT-variability environments
If your AHT varies significantly by agent or contact type, EWT estimates will be wrong. Announcing an inaccurate wait time is worse than saying nothing. Switch to queue position announcements when AHT variability makes time estimates unreliable.
Running at 90%+ occupancy to minimize idle time
This is the most expensive mistake in queue management. The cost of the resulting wait times, abandonment, and agent burnout (US contact center attrition averages 30–45% annually; replacement cost per agent is approximately $7,000) far exceeds the cost of maintaining 80% occupancy with slightly more idle time per agent.
Updating queue position announcements too frequently
Telling a caller their position every 30 seconds creates anxiety, not comfort. Position updates every 2–3 minutes give callers useful information without creating the impression that the queue is moving agonizingly slowly.
Using a single Erlang calculation for the whole day
Call volume varies dramatically across a shift. Staffing calculated for the daily average will over-staff quiet periods and under-staff peaks. Run Erlang at 30-minute intervals and build schedules around those granular outputs.
Not auditing IVR menus regularly
An IVR menu built two years ago may no longer reflect current products, team structure, or customer inquiry patterns. Outdated IVR trees extend time-to-queue-entry, increase AHT, and frustrate callers who can't find the option they need. Audit IVR flows quarterly. See our guide to IVR systems for what to look for.
What to Look for in Queue Management Software
When evaluating a contact center platform on its queue management capabilities, the following criteria matter most:
| Criterion | What to Evaluate |
|---|---|
| WFM integration | Native or deeply integrated WFM with Erlang A/C support and 30-minute interval forecasting. Without accurate staffing, no amount of queue configuration helps. |
| Routing sophistication | FIFO, skills-based, priority, and AI-predictive routing. Overflow rule configuration depth. Sentiment-based escalation. |
| Callback/virtual queue | Position preservation on callback, SMS notification options, failed-callback retry logic, and outbound dialing compliance tools. |
| IVR and self-service | NLU-capable Intelligent Virtual Agent vs. DTMF-only keypad menus. Containment rate benchmarks. Self-service deflection analytics. |
| CRM integration | Pre-built connectors to Salesforce, Zendesk, HubSpot, ServiceNow. Screen-pop on queue connect. Caller history surfacing for agent context. |
| Real-time analytics | Live supervisor dashboards showing queue depth, ASA, abandonment rate, and agent occupancy. Threshold alerts. Automated response triggers. |
| AI capabilities | Predictive volume forecasting accuracy. IVA containment rate. Sentiment routing. Agent Copilot AHT reduction. Incident-mode queue automation. |
| Scalability | Elastic burst capacity for spike events (300–600% surges). Multi-site queue consolidation. Cloud-based elasticity vs. on-premise line-count limits. |
| Reliability | Platform uptime SLA (99.99% is CCaaS standard). What happens to queued calls during an outage. |
| Compliance | SOC 2 Type II. GDPR/CCPA/HIPAA data handling for call recordings and callback consent. TCPA-compliant outbound callback dialing. |
For a broader framework on evaluating contact center platforms, see our contact center buyer's guide and our overview of cloud contact centers. EaseDial's CCaaS platform includes native queue management with skills-based routing, real-time dashboards, virtual queuing, and workforce management tools — see the call queues feature page for specifics.